Filter
4466
Text search:
urban
health
data
Featured
305
1437
Language
4349
95
77
54
38
32
18
8
7
6
5
4
3
3
3
3
3
2
2
2
2
2
2
2
2
2
2
2
2
1
1
1
1
1
1
1
1
1
1
1
1
1
1
1
1
1
1
Document type
2574
946
346
216
200
85
46
36
10
3
2
1
Countries
212
188
157
143
142
131
124
123
112
106
101
98
92
92
83
78
75
72
66
64
57
55
51
49
49
45
43
41
39
39
35
35
35
31
29
27
27
24
24
20
20
20
20
19
18
18
17
17
15
13
13
13
13
12
11
11
11
11
10
9
9
8
8
8
8
8
7
7
7
6
6
6
6
6
6
5
5
5
5
5
4
4
4
4
4
4
4
3
3
3
3
3
3
3
2
2
2
2
2
2
2
2
2
2
2
2
2
2
2
2
2
2
1
1
1
1
1
1
1
1
1
1
1
1
1
1
1
1
1
1
1
1
1
1
1
1
1
1
1
Authors & Publishers
449
151
142
130
108
102
76
55
49
41
33
24
22
22
21
21
21
19
19
18
18
18
18
16
16
16
16
15
14
14
14
14
14
14
14
13
13
13
13
13
13
13
12
12
12
12
12
12
12
12
11
11
11
11
11
11
11
11
11
11
11
10
10
10
10
9
9
9
9
9
9
9
8
8
8
8
8
8
8
8
7
7
7
7
7
7
7
7
7
7
7
7
7
7
7
7
6
6
6
6
6
6
6
6
6
6
6
6
6
6
6
6
6
6
6
6
6
6
6
5
5
5
5
5
5
5
5
5
5
5
5
5
5
5
5
5
5
5
5
5
5
5
5
5
5
5
5
5
4
4
4
4
4
4
4
4
4
4
4
4
4
4
4
4
4
4
4
4
4
4
4
4
4
4
4
4
4
4
4
4
4
4
4
4
4
4
4
4
4
4
4
3
3
3
3
3
3
3
3
3
3
3
3
3
3
3
3
3
3
3
3
3
3
3
3
3
3
3
3
3
3
3
3
3
3
3
3
3
3
3
3
3
3
3
3
3
3
3
3
3
3
3
3
3
3
3
3
3
3
3
3
3
3
3
3
3
3
3
3
3
3
3
3
3
3
3
3
3
3
3
3
3
3
3
3
3
3
3
3
3
3
3
2
2
2
2
2
2
2
2
2
2
2
2
2
2
2
2
2
2
2
2
2
2
2
2
2
2
2
2
2
2
2
2
2
2
2
2
2
2
2
2
2
2
2
2
2
2
2
2
2
2
2
2
2
2
2
2
2
2
2
2
2
2
2
2
2
2
2
2
2
2
2
2
2
2
2
2
2
2
2
2
2
2
2
2
2
2
2
2
2
2
2
2
2
2
2
2
2
2
2
2
2
2
2
2
2
2
2
2
2
2
2
2
2
2
2
2
2
2
2
2
2
2
2
2
2
2
2
2
2
2
2
2
2
2
2
2
2
2
2
2
2
2
2
2
2
2
2
2
2
2
2
2
2
2
2
2
2
2
2
2
2
2
2
2
2
2
2
2
2
2
2
2
2
2
2
2
2
2
2
2
2
2
2
2
2
2
2
2
2
2
2
2
2
2
2
2
2
2
2
2
2
2
2
2
2
2
2
2
2
2
2
2
2
2
2
2
2
2
2
2
2
2
2
2
2
2
2
2
2
2
2
2
2
2
2
2
2
2
2
2
2
2
2
2
2
2
2
2
2
2
2
2
2
2
2
2
2
2
2
1
1
1
1
1
1
1
1
1
1
1
1
1
1
1
1
1
1
1
1
1
1
1
1
1
1
1
1
1
1
1
1
1
1
1
1
1
1
1
1
1
1
1
1
1
1
1
1
1
1
1
1
1
1
1
1
1
1
1
1
1
1
1
1
1
1
1
1
1
1
1
1
1
1
1
1
1
1
1
1
1
1
1
1
1
1
1
1
1
1
1
1
1
1
1
1
1
1
1
1
1
1
1
1
1
1
1
1
1
1
1
1
1
1
1
1
1
1
1
1
1
1
1
1
1
1
1
1
1
1
1
1
1
1
1
1
1
1
1
1
1
1
1
1
1
1
1
1
1
1
1
1
1
1
1
1
1
1
1
1
1
1
1
1
1
1
1
1
1
1
1
1
1
1
1
1
1
1
1
1
1
1
1
1
1
1
1
1
1
1
1
1
1
1
1
1
1
1
1
1
1
1
1
1
1
1
1
1
1
1
1
1
1
1
1
1
1
1
1
1
1
1
1
1
1
1
1
1
1
1
1
1
1
1
1
1
1
1
1
1
1
1
1
1
1
1
1
1
1
1
1
1
1
1
1
1
1
1
1
1
1
1
1
1
1
1
1
1
1
1
1
1
1
1
1
1
1
1
1
1
1
1
1
1
1
1
1
1
1
1
1
1
1
1
1
1
1
1
1
1
1
1
1
1
1
1
1
1
1
1
1
1
1
1
1
1
1
1
1
1
1
1
1
1
1
1
1
1
1
1
1
1
1
1
1
1
1
1
1
1
1
1
1
1
1
1
1
1
1
1
1
1
1
1
1
1
1
1
1
1
1
1
1
1
1
1
1
1
1
1
1
1
1
1
1
1
1
1
1
1
1
1
1
1
1
1
1
1
1
1
1
1
1
1
1
1
1
1
1
1
1
1
1
1
1
1
1
1
1
1
1
1
1
1
1
1
1
1
1
1
1
1
1
1
1
1
1
1
1
1
1
1
1
1
1
1
1
1
1
1
1
1
1
1
1
1
1
1
1
1
1
1
1
1
1
1
1
1
1
1
1
1
1
1
1
1
1
1
1
1
1
1
1
1
1
1
1
1
1
1
1
1
1
1
1
1
1
1
1
1
1
1
1
1
1
1
1
1
1
1
1
1
1
1
1
1
1
1
1
1
1
1
1
1
1
1
1
1
1
1
1
1
1
1
1
1
1
1
1
1
1
1
1
1
1
1
1
1
1
1
1
1
1
1
1
1
1
1
1
1
1
1
1
1
1
1
1
1
1
1
1
1
1
1
1
1
1
1
1
1
1
1
1
1
1
1
1
1
1
1
1
1
1
1
1
1
1
1
1
1
1
1
1
1
1
1
1
1
1
1
1
1
1
1
1
1
1
1
1
1
1
1
1
1
1
1
1
1
1
1
1
1
1
1
1
1
1
1
1
1
1
1
1
1
1
1
1
1
1
1
1
1
1
1
1
1
1
1
1
1
1
1
1
1
1
1
1
1
1
1
1
1
1
1
1
1
1
1
1
1
1
1
1
1
1
1
1
1
1
1
1
1
1
1
1
1
1
1
1
1
1
1
1
1
1
1
1
1
1
1
1
1
1
1
1
1
1
1
1
1
1
1
1
1
1
1
1
1
1
1
1
1
1
1
1
1
1
1
1
1
1
1
1
1
1
1
1
1
1
1
1
1
1
1
1
1
1
1
1
1
1
1
1
1
1
1
1
1
1
1
1
1
1
1
1
1
1
1
1
1
1
1
1
1
1
1
1
1
1
1
1
1
1
1
1
1
1
1
1
1
1
1
1
1
1
1
1
1
1
1
1
1
1
1
1
1
1
1
1
1
1
1
1
1
1
1
1
1
1
1
1
1
1
1
1
1
1
1
1
1
1
1
1
1
1
1
1
1
1
1
1
1
1
1
1
1
1
1
1
1
1
1
1
1
1
1
1
1
1
1
1
1
1
1
1
1
1
1
1
1
1
1
1
1
1
1
1
1
1
1
1
1
1
1
1
1
1
1
1
1
1
1
1
1
1
1
1
1
1
1
1
1
1
1
1
1
1
1
1
1
1
1
1
1
1
1
1
1
1
1
1
1
1
1
1
1
1
1
1
1
1
1
1
1
1
1
1
1
1
1
1
1
1
1
1
1
1
1
1
1
1
1
1
1
1
1
1
1
1
1
1
1
1
1
1
1
1
1
1
1
1
1
1
1
1
1
1
1
1
1
1
1
1
1
1
1
1
1
1
1
1
1
1
1
1
1
1
1
1
1
1
1
1
1
1
1
1
1
1
1
1
1
1
1
1
1
1
1
1
1
1
1
1
1
1
1
1
1
1
1
1
1
1
1
1
1
1
1
1
1
1
1
1
1
1
1
1
1
1
1
1
1
1
1
1
1
1
1
1
1
1
1
1
1
1
1
1
1
1
1
1
1
1
1
1
1
1
1
1
1
1
1
1
1
1
1
1
1
1
1
1
1
1
1
1
1
1
1
1
1
1
1
1
1
1
1
1
1
1
1
1
1
1
1
1
1
1
1
1
1
1
1
1
1
1
1
1
1
1
1
1
1
1
1
1
1
1
1
1
1
1
1
1
1
1
1
1
1
1
1
1
1
1
1
1
1
1
1
1
1
1
1
1
1
1
1
1
1
1
1
1
1
1
1
1
1
1
1
1
1
1
1
1
1
1
1
1
1
1
1
1
1
1
1
1
1
1
1
1
1
1
1
1
1
1
1
1
1
1
1
1
1
1
1
1
1
1
1
1
1
1
1
1
1
1
1
1
1
1
1
1
1
1
1
1
1
1
1
1
1
1
1
1
1
1
1
1
1
1
1
1
1
1
1
1
1
1
1
1
1
1
1
1
1
1
1
1
1
1
1
1
1
1
1
1
1
1
1
1
1
1
1
1
1
1
1
1
1
1
1
1
1
1
1
1
1
1
1
1
1
1
1
1
1
1
1
1
1
1
1
1
1
1
1
1
1
1
1
1
1
1
1
1
1
1
1
1
1
1
1
1
1
1
1
1
1
1
1
1
1
1
1
1
1
1
1
1
1
1
1
1
1
1
1
1
1
1
1
1
1
1
1
1
1
1
1
1
1
1
1
1
1
1
1
1
1
1
1
1
1
1
1
1
1
1
1
1
1
1
1
1
1
1
1
1
1
1
1
1
1
1
1
1
1
1
1
1
1
1
1
1
1
1
1
1
1
1
1
1
1
1
1
1
1
1
1
1
1
1
1
1
1
1
1
1
1
1
1
1
1
1
1
1
1
1
1
1
1
1
1
1
1
1
1
1
1
1
1
1
1
1
1
1
1
1
1
1
1
1
1
1
1
1
1
1
1
1
1
1
1
1
1
1
1
1
1
1
1
1
1
1
1
1
1
1
1
1
1
1
1
1
1
1
1
1
1
1
1
1
1
1
1
1
1
1
1
1
1
1
1
1
1
1
1
1
1
1
1
1
1
1
1
1
1
1
1
1
1
1
1
1
1
1
1
1
1
1
1
1
1
1
1
1
1
1
1
1
1
1
1
1
1
1
1
1
1
1
1
1
1
1
1
1
1
1
1
1
1
1
1
1
1
1
1
1
1
1
1
1
1
1
1
1
1
1
1
1
1
1
1
1
1
1
1
1
1
1
1
1
1
1
1
1
1
1
1
1
1
1
1
1
1
1
1
1
1
1
1
1
1
1
1
1
1
1
1
1
1
1
1
1
1
1
1
1
1
1
1
1
1
1
1
1
1
1
1
1
1
1
1
1
1
1
1
1
1
1
1
1
1
1
1
1
1
1
1
1
1
1
1
1
1
1
1
1
1
1
1
1
1
1
1
1
1
1
1
1
1
1
1
1
1
1
1
1
1
1
1
1
1
1
1
1
1
1
1
1
1
1
1
1
1
1
1
1
1
1
1
1
1
1
1
1
1
1
1
1
1
1
1
1
1
1
1
1
1
1
1
1
1
1
1
1
1
1
1
1
1
1
1
1
1
1
1
1
1
1
1
1
1
1
1
1
1
1
1
1
1
1
1
1
1
1
1
1
1
1
1
1
1
1
1
1
1
1
1
1
1
1
1
1
1
1
1
1
1
1
1
1
1
1
1
1
1
1
1
1
1
1
1
1
1
1
1
1
1
1
1
1
1
1
1
1
1
1
1
1
1
1
1
1
1
1
1
1
1
1
1
1
1
1
1
1
1
1
1
1
1
1
1
1
1
1
1
1
1
1
1
1
1
1
1
1
1
1
1
1
1
1
1
1
1
1
1
1
1
1
1
1
1
1
1
1
1
1
1
1
1
1
1
1
1
1
1
1
1
1
1
1
1
1
1
1
1
1
1
1
1
1
1
1
1
1
1
1
1
1
1
1
1
1
1
1
1
1
1
1
1
1
1
1
1
1
1
1
1
1
1
1
1
1
1
1
1
1
1
1
1
1
1
1
1
1
1
1
1
1
1
1
1
1
1
1
1
1
1
1
1
1
1
1
1
1
1
1
1
1
1
1
1
1
1
1
1
1
1
1
1
1
1
1
1
1
1
1
1
1
1
1
1
1
1
1
1
1
1
1
1
1
1
1
1
1
1
1
1
1
1
1
1
1
1
1
1
1
1
1
1
1
1
1
1
1
1
1
1
1
1
1
1
1
1
1
1
1
1
1
1
1
1
1
1
1
1
1
1
1
1
1
1
1
1
1
1
1
1
1
1
1
1
1
1
1
1
1
1
1
1
1
1
1
1
1
1
1
1
1
1
1
1
1
1
1
1
1
1
1
1
1
1
1
1
1
1
1
1
1
1
1
1
1
1
1
1
1
1
1
1
1
1
1
1
1
1
1
1
1
1
1
1
1
1
1
1
1
1
1
1
1
1
1
1
1
1
1
1
1
1
1
1
1
1
1
1
1
1
1
1
1
1
1
1
1
1
1
1
1
1
1
1
1
1
1
1
1
1
1
1
1
1
1
1
1
1
1
1
1
1
1
1
1
1
1
1
1
1
1
1
1
1
1
1
1
1
1
1
1
1
1
1
1
1
1
1
1
1
1
1
1
1
1
1
1
1
1
1
1
1
1
1
1
1
1
1
1
1
1
1
1
1
1
1
1
1
1
1
1
1
1
1
1
1
1
1
1
1
1
1
1
1
1
1
1
1
1
1
1
1
1
1
1
1
1
1
1
1
1
1
1
1
1
1
1
1
1
1
1
1
1
1
1
1
1
1
1
1
1
1
1
1
1
1
1
1
1
1
1
1
1
1
1
1
1
1
1
1
1
1
1
1
1
1
1
1
1
1
1
1
1
1
1
1
1
1
1
1
1
1
1
1
1
1
1
1
1
1
1
1
1
1
1
1
1
1
1
1
1
1
1
1
1
1
1
1
1
1
1
1
1
1
1
1
1
1
1
1
1
1
1
1
1
1
1
1
1
1
1
1
1
1
1
1
1
1
1
1
1
1
1
1
1
1
1
1
1
1
1
1
1
1
1
1
1
1
1
1
1
1
1
1
1
1
1
1
1
1
1
1
1
1
1
1
1
1
1
1
1
1
1
1
1
1
1
1
1
1
1
1
1
1
1
1
1
1
1
1
1
1
1
1
1
1
1
1
1
1
1
1
1
1
1
1
1
1
1
1
1
1
1
1
1
1
1
1
1
1
1
1
1
1
1
1
1
1
1
1
1
1
1
1
1
1
1
1
1
1
1
1
1
1
1
1
1
1
1
1
1
1
1
1
1
1
1
1
1
1
1
1
1
1
1
1
1
1
1
1
1
1
1
1
1
1
1
1
1
1
1
1
1
1
1
1
1
1
1
1
1
1
1
1
1
1
1
1
1
1
1
1
1
1
1
1
1
1
1
1
1
1
1
1
1
1
1
1
1
1
1
1
1
1
1
1
1
1
1
1
1
1
1
1
1
1
1
1
1
1
1
1
1
1
1
1
1
1
1
1
1
1
1
1
1
1
1
1
1
1
1
1
1
1
1
1
1
1
1
1
1
1
1
1
1
1
1
1
1
1
1
1
1
1
1
1
1
1
1
1
1
1
1
1
1
1
1
1
1
1
1
1
1
1
1
1
1
1
1
1
1
1
1
1
1
1
1
1
1
1
1
1
1
1
1
1
1
1
1
1
1
1
1
1
1
1
1
1
1
1
1
1
1
1
1
1
1
1
1
1
1
1
1
1
1
1
1
1
1
1
1
1
1
1
1
1
1
1
1
1
1
1
1
1
1
1
1
1
1
1
1
1
1
1
1
1
1
1
1
1
1
1
1
1
1
1
1
1
1
1
1
1
1
1
1
1
1
1
1
1
1
1
1
1
1
1
1
1
1
1
1
1
1
1
1
1
1
1
1
1
1
1
1
1
1
1
1
1
1
1
1
1
1
1
1
1
1
1
1
1
1
1
1
1
1
1
1
1
1
1
1
1
1
1
1
1
1
1
1
1
1
1
1
1
1
1
1
1
1
1
1
1
1
1
1
1
1
1
1
1
1
1
1
1
1
1
1
1
1
1
1
1
1
1
1
1
1
1
1
1
1
1
1
1
1
1
1
1
1
1
1
1
1
1
1
1
1
1
1
1
1
1
1
1
1
1
1
1
1
1
1
1
1
1
1
1
1
1
1
1
1
1
1
1
1
1
1
1
1
1
1
1
1
1
1
1
1
1
1
1
1
1
1
1
1
1
1
1
1
1
1
1
1
1
1
1
1
1
1
1
1
1
1
1
1
1
1
1
1
1
1
1
1
1
1
1
1
1
1
1
1
1
1
1
1
1
1
1
1
1
1
1
1
1
1
1
1
1
1
1
1
1
1
1
1
1
1
1
1
1
1
1
1
1
1
1
1
1
1
1
1
1
1
1
1
1
1
1
1
1
1
1
1
1
1
1
1
1
1
1
1
1
1
1
1
1
1
1
1
1
1
1
1
1
1
1
1
1
1
1
1
1
1
1
1
1
1
1
1
1
1
1
1
1
1
1
1
1
1
1
1
1
1
1
1
1
1
1
1
1
1
1
1
1
1
1
1
1
1
1
1
1
1
1
1
1
1
1
1
1
1
1
1
1
1
1
1
1
1
1
1
1
1
1
1
1
1
1
1
1
1
1
1
1
1
1
1
1
1
1
1
1
1
1
1
1
1
1
1
1
1
1
1
1
1
1
1
1
1
1
1
1
1
1
1
1
1
1
1
1
1
1
1
1
1
1
1
1
1
1
1
1
1
1
1
1
1
1
1
1
1
1
1
1
1
1
1
1
1
1
1
1
1
1
1
1
1
1
1
1
1
1
1
1
1
1
1
1
1
1
1
1
1
1
1
1
1
1
1
1
1
1
1
1
1
1
1
1
1
1
1
1
1
1
1
1
1
1
1
1
1
1
1
1
1
1
1
1
1
1
1
1
1
1
1
1
1
1
1
1
1
1
1
1
1
1
1
1
1
Publication Years
1216
2870
358
21
1
Category
2255
286
242
191
166
50
9
Toolboxes
295
294
287
185
163
145
124
116
106
95
89
85
82
75
65
63
51
40
36
33
31
24
21
15
11
3
1
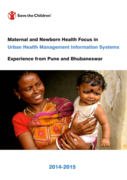
Slum population in India is growing fast (25.1% decadal growth – Census 2011). Its health and nutrition indicators are worse than that of the non slum urban areas and comparable to that of rural I
...
ndia.
The National Urban Health Mission (HUHM), launched in 2013, focuses on improving the health of urban slum population through a needs based, city-specific urban health care system that includes a revamped primary care system, targeted outreach, equitable access, and involvement of the community and urban local bodies (ULBs).
The HUHM recognizes that lack of disaggregated data collected at local and/or city level impedes efficient planning with focus on the urban poor, and that data availability is a critical need.
more
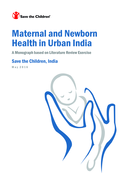
India contributes to 16% of the global maternal deaths and around 27% of global newborn deaths. Reducing the burden of maternal and newborn mortality and morbidity in urban poor settings today requires an expansion of effective Maternal and Newborn
...
Health (MNH) care services and lowering the barriers to the use of such services, especially availability and accessibility.
For designing sensitive, responsive and relevant urban health policy and action, it is important for planners and programme managers to understand the context with regard to current systems and mechanisms, potential organisations and best practices.
In order to adres this need, Save the Children’s Saving Newborn Lives programme commissioned a study that reviewed the literature and looked at available secondary data on MNH in urban poor settings.
more
Cities are uniquely positioned to understand local needs and respond rapidly to changing conditions to safeguard health. These changes require strong city leadership to implement multisectoral, health
...
-relevant policies and public services that engage communities. The response to malaria must be an integral part of such policies and processes.
This framework supports the control and elimination of malaria in urban environments. It provides guidance for city leaders, health programmes and urban planners as they respond to the challenges of rapid urbanization in a targeted way. For each urban context, the strategic use of data can inform effective, tailored responses and help build resilience against the threat of malaria and other vector-borne diseases.
more

Contains data from World Health Organization's data portal covering the following categories:
Mortality and global
...
health estimates, Sustainable development goals, Millennium Development Goals (MDGs), Health systems, Malaria, Tuberculosis, Child health, Infectious diseases, Neglected Tropical Diseases, World Health Statistics, Health financing, Tobacco, Substance use and mental health, Injuries and violence, HIV/AIDS and other STIs, Public health and environment, Nutrition, Urban health, Noncommunicable diseases, Noncommunicable diseases CCS, Negelected tropical diseases, Infrastructure, Essential health technologies, Medical equipment, Demographic and socioeconomic statistics, Health inequality monitor, Health Equity Monitor, Child malnutrition, TOBACCO, Neglected tropical diseases, International Health Regulations (2005) monitoring framework, 0, Insecticide resistance, Oral health, Universal Health Coverage, Global Observatory for eHealth (GOe)
more
Liberia: Demographic and Health Survey 2019-2020
Liberia Institute of Statistics and Geo-Information Services (LISGIS) Monrovia, Liberia
The DHS Program ICF
(2021)
C2
The LDHS provides an opportunity to inform policy and provide data for planning, implementation, and monitoring and evaluation of national health programs. It is designed to provide up-to-date infor
...
mation on health indicators including fertility levels, sexual activity, fertility preferences, awareness and use of family
planning methods, breastfeeding practices, nutritional status of children, early childhood and maternal mortality, maternal and child health, and awareness and behaviors regarding HIV/AIDS and other sexually transmitted infections. The study also incorporated measurements of HIV, hepatitis B, and hepatitis Cprevalence along with seroprevalence of Ebola virus disease antibodies, the results of which will be included in future addendums. In addition to presenting national estimates, the report provides estimates of key indicators for both rural and urban areas, the country’s 15 counties, and the capital, Monrovia.
more
This report provides an overview of air pollution levels and associated health impacts in cities around the world. Since urban areas are often hotspots for poor air quality, city-level
...
data can help to inform targeted efforts to curb urban air pollution and improve public health. This report draws on data from the Global Burden of Disease project and from peer-reviewed analyses led by Susan Anenberg of the George Washington University.
more
DHS Further Analysis Reports No. 109 - This report documents trends in key child nutrition indicators in Rwanda. Data from the Demographic and Health Surveys (DHS) in 2005, 2010, and 2014-15 were an
...
alyzed, disaggregated by selected equity-related variables, and tested for trends. Over the survey period, Rwanda had high rates of exclusive breastfeeding, with regional variation. Rates of continued breastfeeding were also high but generally decreased as mother’s education and household wealth increased in all survey years. Complementary feeding practices varied by region, mother’s education, household wealth, urban-rural residence, and sex of the child.
more
Recent Trends in HIV-Related Knowledge and Behaviors in Rwanda, 2005-2010: Further Analysis of the Demographic and Health Surveys.
Hong, Rathavuth, Jean de Dieu, Jeanine Umutesi Condo, Muhayimpundu Ribakare, and Egidie Murekatete
Calverton, Maryland, USA: ICF International
(2013)
C2
DHS Further Analysis Reports No. 89 - The 2010 Rwanda Demographic and Health Survey shows that 3 percent of Rwandan adults age 15-49 have been infected with HIV. The prevalence was much higher in urban
...
areas, among women, and among adults who had multiple lifetime sexual partners and used a condom at last sexual intercourse. The
level of and differences in HIV prevalence in Rwanda in 2010 are very similar to those observed in 2005. Using data from the two recent Rwanda Demographic and Health Surveys, implemented in 2005 and
2010, this study examined changes in key HIV-related knowledge, attitudes, and sexual behavior indicators. Significant changes in selected indicators during 2005 and 2010 were determined by Student ttest with p-values less than 0.05.
more
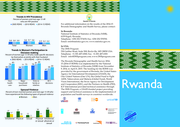
General fact sheet in booklet form about the 2014-2015 Demographic and Health Survey conducted in Rwanda. The 2014-15 Rwanda Demographic and Health Survey (RDHS) provides
...
data for monitoring the health situation of the population in Rwanda. The 2014-15 RDHS is the 5th Demographic and Health Survey conducted in the country. The survey is based on a nationally representative sample. It provides estimates at the national and provincial levels, as well as for urban and rural areas, and for some, at the district level.
more
Project protocol
Introduction Ready-to-eat food sold in the street represents a global phenomenon, more common in urbanized areas, that constitutes an important dietary source in populations from low- and middle-income countries. However, research on the kind of street food offered and its composit
...
ion is scarce. The main objective of this study is to characterize the urban street food environment, including vending places, the food offered, its nutritional composition, food purchasing patterns and advertising.
Methods and analysis This protocol provides a framework for a stepwise, standardized characterization of the street food environment; it consists of three steps that are of increasing complexity and demand increasingly great human and technical resources. Step 1 comprises identification of street food vending sites and characterization of the products available; this stage may be complemented with an evaluation of food advertising in the streets. Step 2 comprises description of street food purchasing patterns, by direct observation. Step 3 requires collection of food samples for bromatological analysis. Different levels of data collection may be defined for each step; hereafter, these are presented as core and expanded evaluations. For the most part, data analysis involves descriptive statistics and basic spatial analysis.
more

DHS Working Papers No. 69
This paper uses data from the three Indian National Family Health Surveys (1992-93, 1998-99, 2005-06) to examine how the relationship between household wealth and chil ... d mortality evolved during a time of significant economic change in India. The main predictor is a new measure of household wealth that captures changes in wealth over time. Outcomes include neonatal mortality, postneonatal mortality, child mortality, and under-five mortality. Multivariate analysis is conducted at the national, urban, rural, and regional levels.
Results indicate that the overall relationship between household wealth and mortality weakened over time, as evidenced by the coefficients for under-five mortality at the national level. more
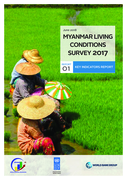
The survey is representative of the Union Territory, its states and regions and urban and rural areas. It was conducted in all the districts and in 296 of the 330 townships of Myanmar. A total of 13,730 households were interviewed. It collects
...
data on the occupations of people, how much income they earn, and how they use this to meet the food, housing, health, education and other needs of their families. The main focus of the survey is to produce estimates of poverty and living conditions, to provide core data inputs into the System of National Accounts and the Consumer Price Index and to support monitoring of the Sustainable Development Goals.
more

Risk factors for asthma among schoolchildren who participated in a casecontrol study in urban Uganda
Data on asthma aetiology in Africa are scarce. We investigated the risk factors for asthma among schoolchildren (5–17 years) in urban Uganda. We conducted a case-control study, among 555 cases and
...
1115 controls. Asthma was diagnosed by study clinicians. The main risk factors for asthma were tertiary education for fathers (adjusted OR (95% CI); 2.32 (1.71–3.16)) and mothers (1.85 (1.38–2.48)); area of residence at birth, with children born in a small town or in the city having an increased asthma risk compared to schoolchildren born in rural areas (2.16 (1.60–2.92)) and (2.79 (1.79–4.35)), respectively; father’s and mother’s history of asthma; children’s own allergic conditions; atopy; and cooking on gas/electricity. In conclusion, asthma was associated with a strong rural-town-city risk gradient, higher parental socio-economic status and urbanicity. This work provides the basis for future studies to identify specific environmental/lifestyle factors responsible for increasing asthma risk among children in urban areas in LMICs.
more

Globally, there is increased advocacy for community-based health insurance (CBHI) schemes. Like other low and middle-income countries (LMICs), Tanzania officially established the Community Health Fu
...
nd (CHF) in 2001 for rural areas; and Tiba Kwa Kadi (TIKA) for urban population since 2009. This study investigated the implementation of TIKA scheme in urban districts of Tanzania.
more