Filter
2618
Text search:
demographic
and
health
survey
Featured
117
1012
Language
2511
72
34
19
13
10
9
4
3
2
1
1
1
1
1
Document type
1780
489
117
81
67
43
16
13
7
3
1
1
Countries
145
130
127
93
93
91
89
88
81
80
79
72
68
68
66
64
62
47
43
43
41
36
33
31
31
30
26
26
25
22
21
21
19
17
16
16
14
13
11
11
10
10
9
9
8
8
8
8
7
7
7
7
6
6
6
6
6
5
5
5
5
5
4
4
4
4
4
3
3
3
3
3
3
3
3
3
2
2
2
2
2
2
2
2
2
2
2
1
1
1
1
1
1
1
1
1
1
1
1
1
1
1
1
1
1
1
1
1
1
1
1
1
1
1
1
1
1
1
1
1
1
Authors & Publishers
203
72
66
66
58
55
54
49
33
31
31
24
24
18
18
17
16
14
13
13
13
12
11
11
11
10
10
10
9
9
9
9
9
9
8
8
8
8
7
7
7
7
7
7
7
7
7
7
7
7
7
7
6
6
6
6
6
6
6
6
6
5
5
5
5
5
5
5
5
5
5
5
5
5
5
5
5
5
5
5
5
5
4
4
4
4
4
4
4
4
4
4
4
4
4
4
4
4
4
4
4
4
4
4
4
4
3
3
3
3
3
3
3
3
3
3
3
3
3
3
3
3
3
3
3
3
3
3
3
3
3
3
3
3
3
3
3
3
3
3
3
3
3
3
3
3
3
3
3
3
3
3
3
3
3
3
3
3
3
3
3
3
3
3
3
3
3
3
3
3
3
2
2
2
2
2
2
2
2
2
2
2
2
2
2
2
2
2
2
2
2
2
2
2
2
2
2
2
2
2
2
2
2
2
2
2
2
2
2
2
2
2
2
2
2
2
2
2
2
2
2
2
2
2
2
2
2
2
2
2
2
2
2
2
2
2
2
2
2
2
2
2
2
2
2
2
2
2
2
2
2
2
2
2
2
2
2
2
2
2
2
2
2
2
2
2
2
2
2
2
2
2
2
2
2
2
2
2
2
2
2
2
2
2
2
2
2
2
2
2
2
2
2
2
2
2
2
2
2
2
2
2
2
2
2
2
2
2
2
2
2
2
2
2
2
2
2
2
2
2
2
2
2
2
2
2
2
2
2
2
2
2
2
2
2
2
2
2
2
2
2
1
1
1
1
1
1
1
1
1
1
1
1
1
1
1
1
1
1
1
1
1
1
1
1
1
1
1
1
1
1
1
1
1
1
1
1
1
1
1
1
1
1
1
1
1
1
1
1
1
1
1
1
1
1
1
1
1
1
1
1
1
1
1
1
1
1
1
1
1
1
1
1
1
1
1
1
1
1
1
1
1
1
1
1
1
1
1
1
1
1
1
1
1
1
1
1
1
1
1
1
1
1
1
1
1
1
1
1
1
1
1
1
1
1
1
1
1
1
1
1
1
1
1
1
1
1
1
1
1
1
1
1
1
1
1
1
1
1
1
1
1
1
1
1
1
1
1
1
1
1
1
1
1
1
1
1
1
1
1
1
1
1
1
1
1
1
1
1
1
1
1
1
1
1
1
1
1
1
1
1
1
1
1
1
1
1
1
1
1
1
1
1
1
1
1
1
1
1
1
1
1
1
1
1
1
1
1
1
1
1
1
1
1
1
1
1
1
1
1
1
1
1
1
1
1
1
1
1
1
1
1
1
1
1
1
1
1
1
1
1
1
1
1
1
1
1
1
1
1
1
1
1
1
1
1
1
1
1
1
1
1
1
1
1
1
1
1
1
1
1
1
1
1
1
1
1
1
1
1
1
1
1
1
1
1
1
1
1
1
1
1
1
1
1
1
1
1
1
1
1
1
1
1
1
1
1
1
1
1
1
1
1
1
1
1
1
1
1
1
1
1
1
1
1
1
1
1
1
1
1
1
1
1
1
1
1
1
1
1
1
1
1
1
1
1
1
1
1
1
1
1
1
1
1
1
1
1
1
1
1
1
1
1
1
1
1
1
1
1
1
1
1
1
1
1
1
1
1
1
1
1
1
1
1
1
1
1
1
1
1
1
1
1
1
1
1
1
1
1
1
1
1
1
1
1
1
1
1
1
1
1
1
1
1
1
1
1
1
1
1
1
1
1
1
1
1
1
1
1
1
1
1
1
1
1
1
1
1
1
1
1
1
1
1
1
1
1
1
1
1
1
1
1
1
1
1
1
1
1
1
1
1
1
1
1
1
1
1
1
1
1
1
1
1
1
1
1
1
1
1
1
1
1
1
1
1
1
1
1
1
1
1
1
1
1
1
1
1
1
1
1
1
1
1
1
1
1
1
1
1
1
1
1
1
1
1
1
1
1
1
1
1
1
1
1
1
1
1
1
1
1
1
1
1
1
1
1
1
1
1
1
1
1
1
1
1
1
1
1
1
1
1
1
1
1
1
1
1
1
1
1
1
1
1
1
1
1
1
1
1
1
1
1
1
1
1
1
1
1
1
1
1
1
1
1
1
1
1
1
1
1
1
1
1
1
1
1
1
1
1
1
1
1
1
1
1
1
1
1
1
1
1
1
1
1
1
1
1
1
1
1
1
1
1
1
1
1
1
1
1
1
1
1
1
1
1
1
1
1
1
1
1
1
1
1
1
1
1
1
1
1
1
1
1
1
1
1
1
1
1
1
1
1
1
1
1
1
1
1
1
1
1
1
1
1
1
1
1
1
1
1
1
1
1
1
1
1
1
1
1
1
1
1
1
1
1
1
1
1
1
1
1
1
1
1
1
1
1
1
1
1
1
1
1
1
1
1
1
1
1
1
1
1
1
1
1
1
1
1
1
1
1
1
1
1
1
1
1
1
1
1
1
1
1
1
1
1
1
1
1
1
1
1
1
1
1
1
1
1
1
1
1
1
1
1
1
1
1
1
1
1
1
1
1
1
1
1
1
1
1
1
1
1
1
1
1
1
1
1
1
1
1
1
1
1
1
1
1
1
1
1
1
1
1
1
1
1
1
1
1
1
1
1
1
1
1
1
1
1
1
1
1
1
1
1
1
1
1
1
1
1
1
1
1
1
1
1
1
1
1
1
1
1
1
1
1
1
1
1
1
1
1
1
1
1
1
1
1
1
1
1
1
1
1
1
1
1
1
1
1
1
1
1
1
1
1
1
1
1
1
1
1
1
1
1
1
1
1
1
1
1
1
1
1
1
1
1
1
1
1
1
1
1
1
1
1
1
1
1
1
1
1
1
1
1
1
1
1
1
1
1
1
1
1
1
1
1
1
1
1
1
1
1
1
1
1
1
1
1
1
1
1
1
1
1
1
1
1
1
1
1
1
1
1
1
1
1
1
1
1
1
1
1
1
1
1
1
1
1
1
1
1
1
1
1
1
1
1
1
1
1
1
1
1
1
1
1
1
1
1
1
1
1
1
1
1
1
1
1
1
1
1
1
1
1
1
1
1
1
1
1
1
1
1
1
1
1
1
1
1
1
1
1
1
1
1
1
1
1
1
1
1
1
1
1
1
1
1
1
1
1
1
1
1
1
1
1
1
1
1
1
1
1
1
1
1
1
1
1
1
1
1
1
1
1
1
1
1
1
1
1
1
1
1
1
1
1
1
1
1
1
1
1
1
1
1
1
1
1
1
1
1
1
1
1
1
1
1
1
1
1
1
1
1
1
1
1
1
1
1
1
1
1
1
1
1
1
1
1
1
1
1
1
1
1
1
1
1
1
1
1
1
1
1
1
1
1
1
1
1
1
1
1
1
1
1
1
1
1
1
1
1
1
1
1
1
1
1
1
1
1
1
1
1
1
1
1
1
1
1
1
1
1
1
1
1
1
1
1
1
1
1
1
1
1
1
1
1
1
1
1
1
1
1
1
1
1
1
1
1
1
1
1
1
1
1
1
1
1
1
1
1
1
1
1
1
1
1
1
1
1
1
1
1
1
1
1
1
1
1
1
1
1
1
1
1
1
1
1
1
1
1
1
1
1
1
1
1
1
1
1
1
1
1
1
1
1
1
1
1
1
1
1
1
1
1
1
1
1
1
1
1
1
1
1
1
1
1
1
1
1
1
1
1
1
1
1
1
1
1
1
1
1
1
1
1
1
1
1
1
1
1
1
1
1
1
1
1
1
1
1
1
1
1
1
1
1
1
1
1
1
1
1
1
1
1
1
1
1
1
1
1
1
1
1
1
1
1
1
1
1
1
1
1
1
1
1
1
1
1
1
1
1
1
1
1
1
1
1
1
1
1
1
1
1
1
1
1
1
1
1
1
1
1
1
1
1
1
1
1
1
1
1
1
1
1
1
1
1
1
1
1
1
1
1
1
1
1
1
1
1
1
1
1
1
1
1
1
1
1
1
1
1
1
1
1
1
1
1
1
1
1
1
1
1
1
1
1
1
1
1
1
1
1
1
1
1
1
1
1
1
1
1
1
1
1
1
1
1
1
1
1
1
1
1
1
1
1
1
1
1
1
1
1
1
1
1
1
1
1
1
1
1
1
1
1
1
1
1
1
1
1
1
1
1
1
1
1
1
1
1
1
1
1
1
1
1
1
1
1
1
1
1
1
1
1
1
1
1
1
1
1
1
1
1
1
1
1
1
1
1
1
1
1
1
1
1
1
1
1
1
1
1
1
1
1
1
1
1
1
1
1
1
1
1
1
1
1
1
1
1
1
1
1
1
1
1
1
1
1
1
1
1
1
1
1
1
1
1
1
1
1
1
1
1
1
1
1
1
1
1
1
1
1
1
1
1
1
1
1
1
1
1
1
1
1
1
1
1
1
1
1
1
1
1
1
1
1
1
1
1
1
1
1
1
1
1
1
1
1
1
1
1
1
1
1
1
1
1
1
1
1
1
1
1
1
1
1
1
1
1
1
1
1
1
1
1
1
1
1
1
1
1
1
1
1
1
1
1
1
1
1
1
1
1
1
1
1
1
1
1
1
1
1
1
1
1
1
1
1
1
1
1
1
1
1
1
1
1
1
1
1
1
1
1
1
1
1
1
1
1
1
1
1
1
1
1
1
1
1
1
1
1
1
1
1
1
1
1
1
1
1
1
1
1
1
1
1
1
1
1
1
1
1
1
1
1
1
1
1
1
1
1
1
1
1
1
1
1
1
1
1
1
1
1
1
1
1
1
1
1
1
1
1
1
1
1
1
1
1
1
1
1
1
1
1
1
1
1
1
1
1
1
1
1
1
1
1
1
1
1
1
1
1
1
1
1
1
1
1
1
1
1
1
1
1
1
1
1
1
1
1
1
1
1
1
1
1
1
1
1
1
1
1
1
1
1
1
1
1
1
1
1
1
1
1
1
1
1
1
1
1
1
1
1
1
1
1
1
1
1
1
1
1
1
1
1
1
1
1
1
1
1
1
1
1
1
1
1
1
1
1
1
1
1
1
1
1
1
1
1
1
1
1
1
1
1
1
1
1
1
1
1
1
1
1
1
1
1
1
1
1
1
1
1
1
1
1
1
1
1
1
1
1
1
1
1
1
1
1
1
1
1
1
1
1
1
1
1
1
1
1
1
1
1
1
1
1
1
1
1
1
1
1
1
1
1
1
1
1
1
1
1
1
1
1
1
1
1
1
1
1
1
1
1
1
1
1
1
1
1
1
1
1
1
1
1
1
1
1
1
1
1
1
1
1
1
1
1
1
1
1
1
1
1
1
1
1
1
1
1
1
1
1
1
1
1
1
1
1
1
1
1
1
1
1
1
1
1
1
1
1
1
1
1
Publication Years
532
1897
183
4
2
Category
1749
128
123
89
73
20
4
Toolboxes
142
99
96
69
57
53
50
48
46
42
35
34
29
29
21
19
16
12
11
8
7
6
5
2
2
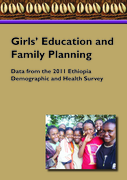
Data from the 2011 Ethiopia Demographic and Health Survey
Sexual and Reproductive Health of Adolescents and Youth In Nepal: Trends and Determinants
Khatiwada N., Silwal P.R., Bhadra R., and Tamang T.M.
Nepal Ministry of Health and Population, New ERA, and ICF International
(2013)
C2
Further analysis of the 2011 Nepal Demographic and Health Survey
Maternal and Child Health in Nepal: The Effects of Caste, Ethnicity, and Regional Identity
Pandey, J. P., M.R. Dhakal, S. Karki, P. Poudel, and M.S. Pradhan
Nepal Ministry of Health and Population, New ERA, and ICF International
(2013)
C2
Further analysis of the 2011 Nepal Demographic and Health Survey

The Burkina Faso Demographic and Health and Multiple Cluster Indicator
...
Survey 2010 (DHS-MICS), or Enquête Démographique et de Santé et à Indicateurs Multiples du Burkina Faso 2010, was conducted by the Institut National de la Statistique et de la Démographie (INSD) of the Ministry of Economy and Plan (MOEP) in collaboration with the Ministry of Health (MOH), with technical assistance from ICF International. Data for this nationally representative survey were collected from 14,424 households, and complete interviews were conducted with 17,087 women aged 15−49 and 7,307 men aged 15–59. The fieldwork took place from May 2010 to January 2011. The summary statistics presented below were taken from the 2010 Burkina Faso DHS-MICS (INSD and ICF International 2012), with exceptions as noted.
more
Global cardiovascular disease (CVD) burden is high and rising, especially in low-income and middle-income countries (LMICs). Focussing on 45 LMICs, we aimed to determine (1) the adult population’s
...
median 10-year predicted CVD risk, including its variation within countries by socio-demographic characteristics, and (2) the prevalence of self-reported blood pressure (BP) medication use among those with and without an indication for such medication as per World Health Organization (WHO) guidelines.
more
Impact of Male Migration on Contraceptive Use, Unmet Need and Fertility in Nepal
Khanal M. N., Shrestha D.R., Panta P.D., and Mehata S.
Nepal Ministry of Health and Population, New ERA, and ICF International
(2013)
C2
Further analysis of the 2011 Nepal Demographic and Health Survey
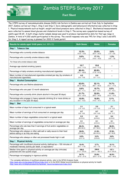
The STEPS survey of noncommunicable disease (NCD) risk factors in Zambia was carried out from July to September 2017. Zambia carried out Step 1, Step 2 and Step 3. Socio
...
demographic and behavioural information was collected in Step 1. Physical measurements such as height, weight and blood pressure were collected in Step 2. Biochemical measurements were collected to assess blood glucose and cholesterol levels in Step 3. The survey was a population-based survey of adults aged 18-69. A multi-stage cluster sample design was used to produce representative data for that age range in Zambia. A total of 4,302 adults participated in the survey. The overall response rate was 74% for Step 1 and 2 and 65% for Step 3. A repeat survey is planned for 2022 if funds permit.
more
The National AIDS Control Council (NACC) continues to strengthen partnerships with all stakeholders in the response to HIV and AIDS in Kenya. While recognizing that there is no single preventive approach to reverse the spread of HIV, the f
...
aith sector comprising of Faith Communities (FCs) and Faith-Based Organizations (FBOs) have demonstrated sustained motivation and moral authority with resources and outreach capability to significantly reduce new HIV infections. In addition, they have the power to influence policy changes to address societal, cultural and structural factors that impede individuals’ capacity to prevent HIV infection. According to Kenya Demographic Health Survey (2014), over 97% of the Kenya population was reported to ascribe to religious affiliation.
more
Demographic Health Survey Working Paper 2017 No. 130
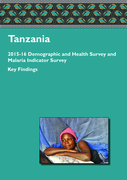
2015-16 Demographic and Health Survey and Mal
...
aria Indicator Survey
more
Data from the 2011 Ethiopia Demographic and Health Survey
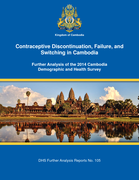
Further Analysis of the 2014 Cambodia Demographic and Health Survey | DHS Further Analysis Repor
...
ts No. 105
more
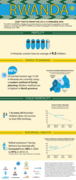
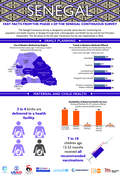
Info-graphic on Fast Facts from the 2014-15 Rwanda Demographic and Health Survey.
Accessed on 31.01.2020
The Senegal Continuous Survey is designed to provide yearly data for monitoring the population and health situation in Se
...
negal through both a Demographic and Health Survey and Service Provision Assessment. The 4th phase of the five-year Continuous Survey was implemented in 2016.
more

Massoda Tonye et al. Malar J (2018) 17:156
https://doi.org/10.1186/s12936-018-2284-7
Background: In 2011, the demographic and health
...
survey (DHS) in Cameroon was combined with the multiple indicator
cluster survey. Malaria parasitological data were collected, but the survey period did not overlap with the high
malaria transmission season. A malaria indicator survey (MIS) was also conducted during the same year, within the
malaria peak transmission season. This study compares estimates of the geographical distribution of malaria parasite
risk and of the effects of interventions obtained from the DHS and MIS survey data.
more
We combine data on Chinese development projects with data from Demographic and Health Surveys to study the impact of Chinese aid on household welfa
...
re in sub-Saharan Africa. We use a novel methodology to test the effect of Chinese aid on three important development outcomes: education, health, and nutrition. For each outcome, we use difference-in-difference estimations to compare household areas near Chinese project sites to control areas located farther away, before and after receiving Chinese aid. This empirical strategy rules out many confounding factors that can bias measuring the impact of Chinese aid on our outcome variables. First, we find that Chinese projects significantly improve education and child mortality in treatment areas, but do not significantly affect nutrition. Second, social sector projects have a larger effect on outcomes than economic projects. Third, we do not find significant effects for projects that ended more than five years before the post-treatment survey wave. Our results are robust to a host of robustness checks.
more
DHS Methodological Report No. 20
This study used Service Provision Assessment (SPA) and Demographic and ... Health Survey (DHS) data from Haiti, Malawi, and Tanzania to compare traditionally used additive methods with a data reduction method—principal component analysis (PCA).
We scored the quality of health facilities with three approaches (simple additive, weighted additive, and PCA) for two constructs: quality of services, with only facilities-level data, and quality of care, which incorporates observation and client data. We ranked facilities as high, medium, or low quality based on their scores. Our results indicated that the rankings change with the scoring methodology. There was more consistency in the rankings of facilities by the simple additive and PCA methods than the weighted additive and PCA-based rankings. This may be due to the low factor loadings and little variance explained by the first component in the PCA. We aggregated facility scores to their respective DHS clusters (Haiti, Malawi) or regions (Tanzania) and geographically linked them to women interviewed in DHS surveys to test associations between the use of family planning services and the quality environment, as measured with each index. more
Women’s Empowerment as a Determinant of Contraceptive Use in Ethiopia
Tadesse, Mekonnen, Habtamu Teklie, Gorfu Yazew, and Tesfayi Gebreselassie
ICF International
(2013)
C2
Further Analysis of the 2011 Ethiopia Demographic and Health
Survey. DHS Further Analysis Repor
...
ts No. 82
more
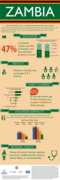
FAST FACTS FROM THE 2013-14 ZAMBIA DEMOGRAPHIC AND HEALTH SURVEY
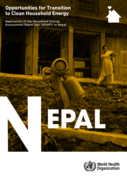
According to the 2016 Nepal Demographic and Health Survey, 66% of Nepali households use mainly s
...
olid fuel for cooking on inefficient stoves. Incomplete fuel combustion of solid fuels emits greenhouse gases and harmful smoke, contributing to climate change, forest degradation, ill health and preventable deaths. Further, the physical burden and time necessary to collect wood for fuel is borne primarily by women and children, thus compromising their productive time, such as social activities and education.
more