Filter
4229
Text search:
Nutrition
support
Featured
356
1333
Language
3966
230
76
57
50
27
20
8
8
7
6
5
4
4
4
3
3
3
3
3
3
2
2
2
2
2
2
2
2
2
2
2
1
1
1
1
1
1
1
1
1
1
1
1
1
1
1
1
1
1
1
1
1
1
1
1
Document type
2436
719
445
209
184
86
62
55
11
10
8
1
1
1
Countries
240
190
169
145
109
105
92
89
87
85
84
82
75
74
73
67
62
54
54
54
53
50
50
40
38
37
37
36
36
36
35
33
32
32
31
27
23
20
18
18
17
16
16
15
14
13
13
13
12
12
11
11
11
10
10
9
9
8
8
8
8
8
8
8
8
7
6
6
6
6
6
5
5
5
5
4
4
4
4
3
3
3
3
3
3
3
3
3
3
3
2
2
2
2
2
2
2
2
2
2
2
2
2
2
2
2
2
2
1
1
1
1
1
1
1
1
1
1
1
1
1
1
1
1
1
1
1
1
1
1
1
1
1
1
1
1
1
Authors & Publishers
381
138
134
124
97
97
80
74
60
44
30
28
27
26
25
25
24
24
23
22
22
21
20
20
20
19
17
16
16
15
15
15
14
14
14
14
13
13
13
13
13
13
13
13
12
12
12
12
12
12
12
11
11
11
10
10
10
10
10
10
10
9
9
9
9
9
9
9
9
9
9
8
8
8
8
8
8
8
7
7
7
7
7
7
7
7
7
7
7
7
7
7
7
7
7
7
7
7
7
6
6
6
6
6
6
6
6
6
6
6
6
6
6
6
6
6
6
6
6
6
6
6
5
5
5
5
5
5
5
5
5
5
5
5
5
5
5
5
5
5
5
5
5
5
5
5
5
5
5
5
5
5
5
5
5
5
5
5
5
5
5
5
5
5
5
5
5
5
4
4
4
4
4
4
4
4
4
4
4
4
4
4
4
4
4
4
4
4
4
4
4
4
4
4
4
4
4
4
4
4
4
4
4
4
4
4
4
4
4
3
3
3
3
3
3
3
3
3
3
3
3
3
3
3
3
3
3
3
3
3
3
3
3
3
3
3
3
3
3
3
3
3
3
3
3
3
3
3
3
3
3
3
3
3
3
3
3
3
3
3
3
3
3
3
3
3
3
3
3
3
3
3
3
3
3
3
3
3
3
3
3
3
3
3
3
3
3
3
3
3
3
3
3
3
3
3
3
3
3
3
3
3
3
3
3
3
3
3
3
3
3
3
3
2
2
2
2
2
2
2
2
2
2
2
2
2
2
2
2
2
2
2
2
2
2
2
2
2
2
2
2
2
2
2
2
2
2
2
2
2
2
2
2
2
2
2
2
2
2
2
2
2
2
2
2
2
2
2
2
2
2
2
2
2
2
2
2
2
2
2
2
2
2
2
2
2
2
2
2
2
2
2
2
2
2
2
2
2
2
2
2
2
2
2
2
2
2
2
2
2
2
2
2
2
2
2
2
2
2
2
2
2
2
2
2
2
2
2
2
2
2
2
2
2
2
2
2
2
2
2
2
2
2
2
2
2
2
2
2
2
2
2
2
2
2
2
2
2
2
2
2
2
2
2
2
2
2
2
2
2
2
2
2
2
2
2
2
2
2
2
2
2
2
2
2
2
2
2
2
2
2
2
2
2
2
2
2
2
2
2
2
2
2
2
2
2
2
2
2
2
2
2
2
2
2
2
2
2
2
2
2
2
2
2
2
2
2
2
2
2
2
2
2
2
2
2
2
1
1
1
1
1
1
1
1
1
1
1
1
1
1
1
1
1
1
1
1
1
1
1
1
1
1
1
1
1
1
1
1
1
1
1
1
1
1
1
1
1
1
1
1
1
1
1
1
1
1
1
1
1
1
1
1
1
1
1
1
1
1
1
1
1
1
1
1
1
1
1
1
1
1
1
1
1
1
1
1
1
1
1
1
1
1
1
1
1
1
1
1
1
1
1
1
1
1
1
1
1
1
1
1
1
1
1
1
1
1
1
1
1
1
1
1
1
1
1
1
1
1
1
1
1
1
1
1
1
1
1
1
1
1
1
1
1
1
1
1
1
1
1
1
1
1
1
1
1
1
1
1
1
1
1
1
1
1
1
1
1
1
1
1
1
1
1
1
1
1
1
1
1
1
1
1
1
1
1
1
1
1
1
1
1
1
1
1
1
1
1
1
1
1
1
1
1
1
1
1
1
1
1
1
1
1
1
1
1
1
1
1
1
1
1
1
1
1
1
1
1
1
1
1
1
1
1
1
1
1
1
1
1
1
1
1
1
1
1
1
1
1
1
1
1
1
1
1
1
1
1
1
1
1
1
1
1
1
1
1
1
1
1
1
1
1
1
1
1
1
1
1
1
1
1
1
1
1
1
1
1
1
1
1
1
1
1
1
1
1
1
1
1
1
1
1
1
1
1
1
1
1
1
1
1
1
1
1
1
1
1
1
1
1
1
1
1
1
1
1
1
1
1
1
1
1
1
1
1
1
1
1
1
1
1
1
1
1
1
1
1
1
1
1
1
1
1
1
1
1
1
1
1
1
1
1
1
1
1
1
1
1
1
1
1
1
1
1
1
1
1
1
1
1
1
1
1
1
1
1
1
1
1
1
1
1
1
1
1
1
1
1
1
1
1
1
1
1
1
1
1
1
1
1
1
1
1
1
1
1
1
1
1
1
1
1
1
1
1
1
1
1
1
1
1
1
1
1
1
1
1
1
1
1
1
1
1
1
1
1
1
1
1
1
1
1
1
1
1
1
1
1
1
1
1
1
1
1
1
1
1
1
1
1
1
1
1
1
1
1
1
1
1
1
1
1
1
1
1
1
1
1
1
1
1
1
1
1
1
1
1
1
1
1
1
1
1
1
1
1
1
1
1
1
1
1
1
1
1
1
1
1
1
1
1
1
1
1
1
1
1
1
1
1
1
1
1
1
1
1
1
1
1
1
1
1
1
1
1
1
1
1
1
1
1
1
1
1
1
1
1
1
1
1
1
1
1
1
1
1
1
1
1
1
1
1
1
1
1
1
1
1
1
1
1
1
1
1
1
1
1
1
1
1
1
1
1
1
1
1
1
1
1
1
1
1
1
1
1
1
1
1
1
1
1
1
1
1
1
1
1
1
1
1
1
1
1
1
1
1
1
1
1
1
1
1
1
1
1
1
1
1
1
1
1
1
1
1
1
1
1
1
1
1
1
1
1
1
1
1
1
1
1
1
1
1
1
1
1
1
1
1
1
1
1
1
1
1
1
1
1
1
1
1
1
1
1
1
1
1
1
1
1
1
1
1
1
1
1
1
1
1
1
1
1
1
1
1
1
1
1
1
1
1
1
1
1
1
1
1
1
1
1
1
1
1
1
1
1
1
1
1
1
1
1
1
1
1
1
1
1
1
1
1
1
1
1
1
1
1
1
1
1
1
1
1
1
1
1
1
1
1
1
1
1
1
1
1
1
1
1
1
1
1
1
1
1
1
1
1
1
1
1
1
1
1
1
1
1
1
1
1
1
1
1
1
1
1
1
1
1
1
1
1
1
1
1
1
1
1
1
1
1
1
1
1
1
1
1
1
1
1
1
1
1
1
1
1
1
1
1
1
1
1
1
1
1
1
1
1
1
1
1
1
1
1
1
1
1
1
1
1
1
1
1
1
1
1
1
1
1
1
1
1
1
1
1
1
1
1
1
1
1
1
1
1
1
1
1
1
1
1
1
1
1
1
1
1
1
1
1
1
1
1
1
1
1
1
1
1
1
1
1
1
1
1
1
1
1
1
1
1
1
1
1
1
1
1
1
1
1
1
1
1
1
1
1
1
1
1
1
1
1
1
1
1
1
1
1
1
1
1
1
1
1
1
1
1
1
1
1
1
1
1
1
1
1
1
1
1
1
1
1
1
1
1
1
1
1
1
1
1
1
1
1
1
1
1
1
1
1
1
1
1
1
1
1
1
1
1
1
1
1
1
1
1
1
1
1
1
1
1
1
1
1
1
1
1
1
1
1
1
1
1
1
1
1
1
1
1
1
1
1
1
1
1
1
1
1
1
1
1
1
1
1
1
1
1
1
1
1
1
1
1
1
1
1
1
1
1
1
1
1
1
1
1
1
1
1
1
1
1
1
1
1
1
1
1
1
1
1
1
1
1
1
1
1
1
1
1
1
1
1
1
1
1
1
1
1
1
1
1
1
1
1
1
1
1
1
1
1
1
1
1
1
1
1
1
1
1
1
1
1
1
1
1
1
1
1
1
1
1
1
1
1
1
1
1
1
1
1
1
1
1
1
1
1
1
1
1
1
1
1
1
1
1
1
1
1
1
1
1
1
1
1
1
1
1
1
1
1
1
1
1
1
1
1
1
1
1
1
1
1
1
1
1
1
1
1
1
1
1
1
1
1
1
1
1
1
1
1
1
1
1
1
1
1
1
1
1
1
1
1
1
1
1
1
1
1
1
1
1
1
1
1
1
1
1
1
1
1
1
1
1
1
1
1
1
1
1
1
1
1
1
1
1
1
1
1
1
1
1
1
1
1
1
1
1
1
1
1
1
1
1
1
1
1
1
1
1
1
1
1
1
1
1
1
1
1
1
1
1
1
1
1
1
1
1
1
1
1
1
1
1
1
1
1
1
1
1
1
1
1
1
1
1
1
1
1
1
1
1
1
1
1
1
1
1
1
1
1
1
1
1
1
1
1
1
1
1
1
1
1
1
1
1
1
1
1
1
1
1
1
1
1
1
1
1
1
1
1
1
1
1
1
1
1
1
1
1
1
1
1
1
1
1
1
1
1
1
1
1
1
1
1
1
1
1
1
1
1
1
1
1
1
1
1
1
1
1
1
1
1
1
1
1
1
1
1
1
1
1
1
1
1
1
1
1
1
1
1
1
1
1
1
1
1
1
1
1
1
1
1
1
1
1
1
1
1
1
1
1
1
1
1
1
1
1
1
1
1
1
1
1
1
1
1
1
1
1
1
1
1
1
1
1
1
1
1
1
1
1
1
1
1
1
1
1
1
1
1
1
1
1
1
1
1
1
1
1
1
1
1
1
1
1
1
1
1
1
1
1
1
1
1
1
1
1
1
1
1
1
1
1
1
1
1
1
1
1
1
1
1
1
1
1
1
1
1
1
1
1
1
1
1
1
1
1
1
1
1
1
1
1
1
1
1
1
1
1
1
1
1
1
1
1
1
1
1
1
1
1
1
1
1
1
1
1
1
1
1
1
1
1
1
1
1
1
1
1
1
1
1
1
1
1
1
1
1
1
1
1
1
1
1
1
1
1
1
1
1
1
1
1
1
1
1
1
1
1
1
1
1
1
1
1
1
1
1
1
1
1
1
1
1
1
1
1
1
1
1
1
1
1
1
1
1
1
1
1
1
1
1
1
1
1
1
1
1
1
1
1
1
1
1
1
1
1
1
1
1
1
1
1
1
1
1
1
1
1
1
1
1
1
1
1
1
1
1
1
1
1
1
1
1
1
1
1
1
1
1
1
1
1
1
1
1
1
1
1
1
1
1
1
1
1
1
1
1
1
1
1
1
1
1
1
1
1
1
1
1
1
1
1
1
1
1
1
1
1
1
1
1
1
1
1
1
1
1
1
1
1
1
1
1
1
1
1
1
1
1
1
1
1
1
1
1
1
1
1
1
1
1
1
1
1
1
1
1
1
1
1
1
1
1
1
1
1
1
1
1
1
1
1
1
1
1
1
1
1
1
1
1
1
1
1
1
1
1
1
1
1
1
1
1
1
1
1
1
1
1
1
1
1
1
1
1
1
1
1
1
1
1
1
1
1
1
1
1
1
1
1
1
1
1
1
1
1
1
1
1
1
1
1
1
1
1
1
1
1
1
1
1
1
1
1
1
1
1
1
1
1
1
1
1
1
1
1
1
1
1
1
1
1
1
1
1
1
1
1
1
1
1
1
1
1
1
1
1
1
1
1
1
1
1
1
1
1
1
1
1
1
1
1
1
1
1
1
1
1
1
1
1
1
1
1
1
1
1
1
1
1
1
1
1
1
1
1
1
1
1
1
1
1
1
1
1
1
1
1
1
1
1
1
1
1
1
1
1
1
1
1
1
1
1
1
1
1
1
1
1
1
1
1
1
1
1
1
1
1
1
1
1
1
1
1
1
1
1
1
1
1
1
1
1
1
1
1
1
1
1
1
1
1
1
1
1
1
1
1
1
1
1
1
1
1
1
1
1
1
1
1
1
1
1
1
1
1
1
1
1
1
1
1
1
1
1
1
1
1
1
1
1
1
1
1
1
1
1
1
1
1
1
1
1
1
1
1
1
1
1
1
1
1
1
1
1
1
1
1
1
1
1
1
1
1
1
1
1
1
1
1
1
1
1
1
1
1
1
1
1
1
1
1
1
1
1
1
1
1
1
1
1
1
1
1
1
1
1
1
1
1
1
1
1
1
1
1
1
1
1
1
1
1
1
1
1
1
1
1
1
1
1
1
1
1
1
1
1
1
1
1
1
1
1
1
1
1
1
1
1
1
1
1
1
1
1
1
1
1
1
1
1
1
1
1
1
1
1
1
1
1
1
1
1
1
1
1
1
1
1
1
1
1
1
1
1
1
1
1
1
1
1
1
1
1
1
1
1
1
1
1
1
1
1
1
1
1
1
1
1
1
1
1
1
1
1
1
1
1
1
1
1
1
1
1
1
1
1
1
1
1
1
1
1
1
1
1
1
1
1
1
1
1
1
1
1
1
1
1
1
1
1
1
1
1
1
1
1
1
1
1
1
1
1
1
1
1
1
1
1
1
1
1
1
1
1
1
1
1
1
1
1
1
1
1
1
1
1
1
1
1
1
1
1
1
1
1
1
1
1
1
1
1
1
1
1
1
1
1
1
1
1
1
1
1
1
1
1
1
1
1
1
1
1
1
1
1
1
1
1
1
1
1
1
1
1
1
1
1
1
1
1
1
1
1
1
1
1
1
1
1
1
1
1
1
1
1
1
1
1
1
1
1
1
1
1
1
1
1
1
1
1
1
1
1
1
1
1
1
1
1
1
1
1
1
1
1
1
1
1
1
1
1
1
1
1
1
1
1
1
1
1
1
1
1
1
1
1
1
1
1
1
1
1
1
1
1
1
1
1
1
1
1
1
1
1
1
1
1
1
1
1
1
1
1
1
1
1
1
1
1
1
1
1
1
1
1
1
1
1
1
1
1
1
1
1
1
1
1
1
1
1
1
1
1
1
1
1
1
1
1
1
1
1
1
1
1
1
1
1
1
1
1
1
1
1
1
1
1
1
1
1
1
1
1
1
1
1
1
1
1
1
1
1
1
1
1
1
1
1
1
1
1
1
1
1
1
1
1
1
1
1
1
1
1
1
1
1
1
1
1
1
1
1
1
1
1
1
1
1
1
1
1
1
1
1
1
1
1
1
1
1
1
1
1
1
1
1
1
1
1
1
1
1
1
1
1
1
1
1
1
1
1
1
1
1
1
1
1
1
1
1
1
1
1
1
1
1
1
1
1
1
1
1
1
1
1
1
1
1
1
1
1
1
1
1
1
1
1
1
1
1
1
1
1
1
1
1
1
1
1
1
1
1
1
1
1
1
1
1
1
1
1
1
1
1
1
1
1
1
1
1
1
1
1
1
1
1
1
1
1
1
1
1
1
1
1
1
1
1
1
1
1
1
1
1
1
1
1
1
1
1
1
1
1
1
1
1
1
1
1
1
Publication Years
1148
2668
391
18
4
Category
2006
354
299
245
245
98
8
Toolboxes
270
210
208
180
166
166
134
103
90
89
83
83
61
56
46
43
40
40
29
29
26
13
13
12
11
4
2
he National Institute of statistics of Rwanda (NISR) in collaboration with the worldwide Demographic and Health Surveys Program implemented the 2014-15 Rwanda Demographic and Health Survey (RDHS) to collect data for monitoring progress on health programs and policies in Rwanda. This publication illu
...
strates the profile of Northern Province.
more

The National Institute of statistics of Rwanda (NISR) in collaboration with the worldwide Demographic and Health Surveys Program implemented the 2014-15 Rwanda Demographic and Health Survey (RDHS) to collect data for monitoring progress on health programs and policies in Rwanda. This publication ill
...
ustrates the profile of Southern province
more

This report provides an update on the level of poverty based on 2013/14 Integrated Household Living Conditions Survey (EICV4) focusing on poverty as measured in consumption terms. The report also highlights other trend dimensions of living conditions captured in other surveys that complement and pro
...
vide a holistic understanding of poverty and living conditions.
Rwanda’s economy has been growing steadily at about 8% since 2001 with GDP per capita more than tripling from US$ 211 in 2001 to US$ 718 in 2014. Food crop production growth was more than twice that of population growth between 2007 and 2014.
more
DHS Methodological Report No. 20
This study used Service Provision Assessment (SPA) and Demographic and Health Survey (DHS) data from Haiti, Malawi, and Tanzania to compare traditionally used additive methods with a data reduction method—principal component analysis (PCA).
We scored ... the quality of health facilities with three approaches (simple additive, weighted additive, and PCA) for two constructs: quality of services, with only facilities-level data, and quality of care, which incorporates observation and client data. We ranked facilities as high, medium, or low quality based on their scores. Our results indicated that the rankings change with the scoring methodology. There was more consistency in the rankings of facilities by the simple additive and PCA methods than the weighted additive and PCA-based rankings. This may be due to the low factor loadings and little variance explained by the first component in the PCA. We aggregated facility scores to their respective DHS clusters (Haiti, Malawi) or regions (Tanzania) and geographically linked them to women interviewed in DHS surveys to test associations between the use of family planning services and the quality environment, as measured with each index. more
The Report describes the evaluation of WHO's contribution to the Maternal Health Program in South-East Asia Region. This was an independent evaluation conducted in 2015 by Amaltas, a Delhi based organization. The evaluation highlights the progress in five countries, namely Bangladesh, Indonesia, Mya
...
nmar, Nepal and Sri Lanka and provides specific recommendations for Organizational Learning and Development. This report will be useful for all those interested in WHO's work on Maternal Health Program in the Region.
more
Policy Research Working Paper 6100 | Impact Evaluation Series No. 60 | This study examines the effect of performance incentives for health care providers to provide more and higher quality care in Rwanda on child health outcomes. The authors find that the incentives had a large and significant effec
...
t on the weight-for-age of children 0–11 months and on the height-for-age of children 24–49 months. They attribute this improvement to increases in the use and quality of prenatal and postnatal care. Consistent with theory, They find larger effects of incentives on services where monetary rewards and the marginal return to effort are higher. The also find that incentives reduced the gap between provider knowledge and practice of appropriate clinical procedures by 20 percent, implying a large gain in efficiency. Finally, they find evidence of a strong complementarity between performance incentives and provider skill .
more
Paying for performance (P4P) provides financial incentives for providers to increase the use and quality of care. P4P can affect health care by providing incentives for providers to put more effort into specific activities, and by increasing the amount of resources available to finance the delivery
...
of services. This paper evaluates the impact of P4P on the use and quality of prenatal, institutional delivery, and child preventive care using data produced from a prospective quasi-experimental evaluation nested into the national rollout of P4P in Rwanda. Treatment facilities were enrolled in the P4P scheme in 2006 and comparison facilities were enrolled two years later. The incentive effect is isolated from the resource effect by increasing comparison facilities’ input-based budgets by the average P4P payments to the treatment facilities. The data were collected from 166 facilities and a random sample of 2158 households. P4P had a large and significant positive impact on institutional deliveries and preventive care visits by young children, and improved quality of prenatal care. The authors find no effect on the number of prenatal care visits or on immunization rates. P4P had the greatest effect on those services that had the highest payment rates and needed the lowest provider effort. P4P financial performance incentives can improve both the use of and the quality of health services. Because the analysis isolates the incentive effect from the resource effect in P4P, the results indicate that an equal amount of financial resources without the incentives would not have achieved the same gain in outcomes.
more
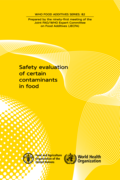
This volume contains monographs prepared at the ninety-first meeting of the Joint FAO/WHO Expert Committee on Food Additives (JECFA), which met virtually online from 1 to 12 February 2021.
The detailed monographs in this volume summarize data on specific contaminants in food. Individual monographs
...
present the assessment of exposure to cadmium from all food sources, the technical, analytical, dietary exposure and toxicological data on ergot alkaloids, an assessment of five substances that may occur as previous cargoes, and a revision of the specifications for steviol glycosides. This volume and others in the WHO Food Additives series contain information that is useful to those who produce and use food additives and veterinary drugs and those involved with controlling contaminants in food, government and food regulatory officers, industrial testing laboratories, toxicological laboratories and universities.
more
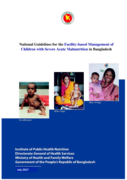
Level of stunting among Bangladeshi children <5years declined from 51% in 2004 to 36% and underweight from 41% in 2007 to 33% (BDHS 2014). But the decrease in wasting rate is not as expected, which is only from 17% to 14.3 % over last decade. Approximately 3.1 % (BDHS 2014) of under-5 children suffering from SAM only b
...
y weight-for-length or height z-score (WHZ) <-3 criterion and estimated to be a total of ~ 450,000. Because, there are no national information on prevalence of SAM using mid upper arm circumference (MUAC) and presence of bipedal oedema in under-5 children, thus the actual number of children suffering from SAM could be much higher than the current estimate.
more

The main objective of the malaria prevention and control programme in Somalia is to prevent mortality and reduce morbidity due to malaria. The groups most vulnerable to the disease, children aged under 5 years and pregnant women, are especially targeted. Effective case management - early diagnosis a
...
nd treatment - is a critical component of malaria prevention and control. To achieve the main objective of reducing malaria morbidity and prevention of malaria mortality, the availability of safe, effective, affordable and accessible anti-malarial drugs is a prerequisite.
more

Menstrual Hgiene Management Toolkit
recommended
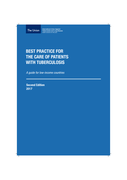
Best Practice for the Care of Patients with Tuberculosis: a Guide for Low-Income Countries
recommended
G. Williams, E. Alarcón, S. Jittimanee et al.
The International Union Against Tuberculosis and Lung Disease
(2017)
CC
2nd edition.
The practical aspects of TB patient care from the onset of symptoms to the completion of treatment are covered in this guide

The bill details procedures for accreditation and supervision of infertility clinics (and related organizations such as semen banks) handling spermatozoa or oocytes outside of the body, or dealing with gamete donors and surrogacy, ensuring that the legitimate rights of all concerned are protected, w
...
ith maximum benefit to the infertile couples/individuals within a recognized framework of ethics and good medical practice.
more


In its resolution 34/16, the Human Rights Council decided to focus its next full-day meeting on “Protecting the rights of the child in humanitarian situations” and invited the Office of the High Commissioner to prepare a report on that issue, in close collaboration with relevant stakeholders. Th
...
e report is to be presented to the Human Rights Council at its thirty-seventh session to inform the annual day of discussion on children’s rights.
more
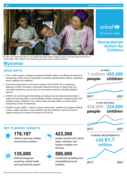
Over 1 million people, including an estimated 450,000 children, are affected by Myanmar’s decade-long conflict and are increasingly vulnerable to gender-based violence, exploitation, abuse, detention and trafficking.
Community transmission of coronavirus disease 2019 (COVID-19) is increasing in
...
Myanmar. COVID-19 requires a nationwide response focusing on critical urban and vulnerable populations, such as those in overcrowded camps for internally displaced persons.
more