Filter
3720
Text search:
internet
Featured
292
864
Language
2587
517
474
203
130
99
95
55
33
32
24
21
21
20
20
20
18
16
15
15
13
12
11
10
8
8
7
7
7
7
7
7
7
6
6
6
6
6
5
5
5
5
5
4
4
4
4
3
3
3
3
2
2
2
2
2
2
2
2
2
1
1
1
1
1
1
1
1
1
1
1
1
1
1
1
1
1
1
1
1
1
1
1
1
1
1
1
1
1
1
1
1
1
1
1
1
1
1
Document type
1839
662
557
246
161
79
68
42
28
21
8
3
2
2
Countries
147
142
111
101
92
83
73
68
64
63
61
60
57
55
54
54
49
48
47
45
45
42
41
41
38
37
36
36
33
32
31
30
28
27
26
26
25
25
24
21
21
20
20
19
19
18
18
17
17
16
15
15
15
14
13
11
11
11
10
10
9
9
9
9
9
9
7
7
7
7
6
6
6
6
6
6
5
5
5
4
4
4
4
4
4
3
3
3
3
3
3
3
3
3
3
3
3
3
3
3
3
3
2
2
2
2
2
2
2
2
2
2
2
2
2
1
1
1
1
1
1
1
1
1
1
1
1
1
1
1
1
1
1
1
1
1
1
1
1
1
1
1
1
1
Authors & Publishers
305
135
91
88
83
83
75
54
43
42
41
40
39
31
30
29
29
28
22
21
21
16
16
16
15
15
14
14
14
13
13
13
13
13
13
12
12
11
11
11
10
10
10
10
10
10
10
10
10
9
9
9
9
9
9
9
8
8
8
8
8
7
7
7
7
7
7
7
7
6
6
6
6
6
6
6
6
6
6
6
6
6
6
6
6
5
5
5
5
5
5
5
5
5
5
5
5
5
5
5
5
5
5
5
5
5
5
5
5
5
5
5
5
5
5
4
4
4
4
4
4
4
4
4
4
4
4
4
4
4
4
4
4
4
4
4
4
4
4
4
4
4
4
4
4
4
4
4
4
4
4
4
4
4
4
4
4
4
4
3
3
3
3
3
3
3
3
3
3
3
3
3
3
3
3
3
3
3
3
3
3
3
3
3
3
3
3
3
3
3
3
3
3
3
3
3
3
3
3
3
3
3
3
3
3
3
3
3
3
3
3
3
3
3
3
3
3
3
3
3
3
3
3
3
3
3
3
3
3
3
3
3
3
3
3
3
3
3
3
3
3
3
3
3
3
3
3
3
3
3
3
3
3
3
3
3
3
3
3
3
3
3
3
3
3
3
3
3
3
3
3
3
3
2
2
2
2
2
2
2
2
2
2
2
2
2
2
2
2
2
2
2
2
2
2
2
2
2
2
2
2
2
2
2
2
2
2
2
2
2
2
2
2
2
2
2
2
2
2
2
2
2
2
2
2
2
2
2
2
2
2
2
2
2
2
2
2
2
2
2
2
2
2
2
2
2
2
2
2
2
2
2
2
2
2
2
2
2
2
2
2
2
2
2
2
2
2
2
2
2
2
2
2
2
2
2
2
2
2
2
2
2
2
2
2
2
2
2
2
2
2
2
2
2
2
2
2
2
2
2
2
2
2
2
2
2
2
2
2
2
2
2
2
2
2
2
2
2
2
2
2
2
2
2
2
2
2
2
2
2
2
2
2
2
2
2
2
2
2
2
2
2
2
2
2
2
2
2
2
2
2
2
2
2
2
2
2
2
2
2
2
2
2
2
2
2
2
2
2
2
2
2
2
2
2
2
2
2
2
2
2
2
2
2
2
2
2
2
2
2
2
2
2
2
2
2
2
2
2
2
2
2
2
2
2
2
2
2
2
2
2
2
2
2
2
2
2
2
2
2
2
2
2
2
1
1
1
1
1
1
1
1
1
1
1
1
1
1
1
1
1
1
1
1
1
1
1
1
1
1
1
1
1
1
1
1
1
1
1
1
1
1
1
1
1
1
1
1
1
1
1
1
1
1
1
1
1
1
1
1
1
1
1
1
1
1
1
1
1
1
1
1
1
1
1
1
1
1
1
1
1
1
1
1
1
1
1
1
1
1
1
1
1
1
1
1
1
1
1
1
1
1
1
1
1
1
1
1
1
1
1
1
1
1
1
1
1
1
1
1
1
1
1
1
1
1
1
1
1
1
1
1
1
1
1
1
1
1
1
1
1
1
1
1
1
1
1
1
1
1
1
1
1
1
1
1
1
1
1
1
1
1
1
1
1
1
1
1
1
1
1
1
1
1
1
1
1
1
1
1
1
1
1
1
1
1
1
1
1
1
1
1
1
1
1
1
1
1
1
1
1
1
1
1
1
1
1
1
1
1
1
1
1
1
1
1
1
1
1
1
1
1
1
1
1
1
1
1
1
1
1
1
1
1
1
1
1
1
1
1
1
1
1
1
1
1
1
1
1
1
1
1
1
1
1
1
1
1
1
1
1
1
1
1
1
1
1
1
1
1
1
1
1
1
1
1
1
1
1
1
1
1
1
1
1
1
1
1
1
1
1
1
1
1
1
1
1
1
1
1
1
1
1
1
1
1
1
1
1
1
1
1
1
1
1
1
1
1
1
1
1
1
1
1
1
1
1
1
1
1
1
1
1
1
1
1
1
1
1
1
1
1
1
1
1
1
1
1
1
1
1
1
1
1
1
1
1
1
1
1
1
1
1
1
1
1
1
1
1
1
1
1
1
1
1
1
1
1
1
1
1
1
1
1
1
1
1
1
1
1
1
1
1
1
1
1
1
1
1
1
1
1
1
1
1
1
1
1
1
1
1
1
1
1
1
1
1
1
1
1
1
1
1
1
1
1
1
1
1
1
1
1
1
1
1
1
1
1
1
1
1
1
1
1
1
1
1
1
1
1
1
1
1
1
1
1
1
1
1
1
1
1
1
1
1
1
1
1
1
1
1
1
1
1
1
1
1
1
1
1
1
1
1
1
1
1
1
1
1
1
1
1
1
1
1
1
1
1
1
1
1
1
1
1
1
1
1
1
1
1
1
1
1
1
1
1
1
1
1
1
1
1
1
1
1
1
1
1
1
1
1
1
1
1
1
1
1
1
1
1
1
1
1
1
1
1
1
1
1
1
1
1
1
1
1
1
1
1
1
1
1
1
1
1
1
1
1
1
1
1
1
1
1
1
1
1
1
1
1
1
1
1
1
1
1
1
1
1
1
1
1
1
1
1
1
1
1
1
1
1
1
1
1
1
1
1
1
1
1
1
1
1
1
1
1
1
1
1
1
1
1
1
1
1
1
1
1
1
1
1
1
1
1
1
1
1
1
1
1
1
1
1
1
1
1
1
1
1
1
1
1
1
1
1
1
1
1
1
1
1
1
1
1
1
1
1
1
1
1
1
1
1
1
1
1
1
1
1
1
1
1
1
1
1
1
1
1
1
1
1
1
1
1
1
1
1
1
1
1
1
1
1
1
1
1
1
1
1
1
1
1
1
1
1
1
1
1
1
1
1
1
1
1
1
1
1
1
1
1
1
1
1
1
1
1
1
1
1
1
1
1
1
1
1
1
1
1
1
1
1
1
1
1
1
1
1
1
1
1
1
1
1
1
1
1
1
1
1
1
1
1
1
1
1
1
1
1
1
1
1
1
1
1
1
1
1
1
1
1
1
1
1
1
1
1
1
1
1
1
1
1
1
1
1
1
1
1
1
1
1
1
1
1
1
1
1
1
1
1
1
1
1
1
1
1
1
1
1
1
1
1
1
1
1
1
1
1
1
1
1
1
1
1
1
1
1
1
1
1
1
1
1
1
1
1
1
1
1
1
1
1
1
1
1
1
1
1
1
1
1
1
1
1
1
1
1
1
1
1
1
1
1
1
1
1
1
1
1
1
1
1
1
1
1
1
1
1
1
1
1
1
1
1
1
1
1
1
1
1
1
1
1
1
1
1
1
1
1
1
1
1
1
1
1
1
1
1
1
1
1
1
1
1
1
1
1
1
1
1
1
1
1
1
1
1
1
1
1
1
1
1
1
1
1
1
1
1
1
1
1
1
1
1
1
1
1
1
1
1
1
1
1
1
1
1
1
1
1
1
1
1
1
1
1
1
1
1
1
1
1
1
1
1
1
1
1
1
1
1
1
1
1
1
1
1
1
1
1
1
1
1
1
1
1
1
1
1
1
1
1
1
1
1
1
1
1
1
1
1
1
1
1
1
1
1
1
1
1
1
1
1
1
1
1
1
1
1
1
1
1
1
1
1
1
1
1
1
1
1
1
1
1
1
1
1
1
1
1
1
1
1
1
1
1
1
1
1
1
1
1
1
1
1
1
1
1
1
1
1
1
1
1
1
1
1
1
1
1
1
1
1
1
1
1
1
1
1
1
1
1
1
1
1
1
1
1
1
1
1
1
1
1
1
1
1
1
1
1
1
1
1
1
1
1
1
1
1
1
1
1
1
1
1
1
1
1
1
1
1
1
1
1
1
1
1
1
1
1
1
1
1
1
1
1
1
1
1
1
1
1
1
1
1
1
1
1
1
1
1
1
1
1
1
1
1
1
1
1
1
1
1
1
1
1
1
1
1
1
1
1
1
1
1
1
1
1
1
1
1
1
1
1
1
1
1
1
1
1
1
1
1
1
1
1
1
1
1
1
1
1
1
1
1
1
1
1
1
1
1
1
1
1
1
1
1
1
1
1
1
1
1
1
1
1
1
1
1
1
1
1
1
1
1
1
1
1
1
1
1
1
1
1
1
1
1
1
1
1
1
1
1
1
1
1
1
1
1
1
1
1
1
1
1
1
1
1
1
1
1
1
1
1
1
1
1
1
1
1
1
1
1
1
1
1
1
1
1
1
1
1
1
1
1
1
1
1
1
1
1
1
1
1
1
1
1
1
1
1
1
1
1
1
1
1
1
1
1
1
1
1
1
1
1
1
1
1
1
1
1
1
1
1
1
1
1
1
1
1
1
1
1
1
1
1
1
1
1
1
1
1
1
1
1
1
1
1
1
1
1
1
1
1
1
1
1
1
1
1
1
1
1
1
1
1
1
1
1
1
1
1
1
1
1
1
1
1
1
1
1
1
1
1
1
1
1
1
1
1
1
1
1
1
1
1
1
1
1
1
1
1
1
1
1
1
1
1
1
1
1
1
1
1
1
1
1
1
1
1
1
1
1
1
1
1
1
1
1
1
1
1
1
1
1
1
1
1
1
1
1
1
1
1
1
1
1
1
1
1
1
1
1
1
1
1
1
1
1
1
1
1
1
1
1
1
1
1
1
1
1
1
1
1
1
1
1
1
1
1
1
1
1
1
1
1
1
1
1
1
1
1
1
1
1
1
1
1
1
1
1
1
1
1
1
1
1
1
1
1
1
1
1
1
1
1
1
1
1
1
1
1
1
1
1
1
1
1
1
1
1
1
1
1
1
1
1
1
1
1
1
1
1
1
1
1
1
1
1
1
1
1
1
1
1
1
1
1
1
1
1
1
1
1
1
1
1
1
1
1
1
1
1
1
1
1
1
1
1
1
1
1
1
1
1
1
1
1
1
1
1
1
1
1
1
1
1
1
1
1
1
1
1
1
1
1
1
1
1
1
1
1
1
1
1
1
1
1
1
1
1
1
1
1
1
1
1
1
1
1
1
1
1
1
1
1
1
1
1
1
1
1
1
1
1
1
1
1
1
1
1
1
1
1
1
1
1
1
1
1
1
1
1
1
1
1
1
1
1
1
1
1
1
1
1
1
1
1
1
1
1
1
1
1
1
1
1
1
1
1
1
1
1
1
1
1
1
1
1
1
1
1
1
1
1
1
1
1
1
1
1
1
1
1
1
1
1
1
1
1
1
1
1
1
1
1
1
1
1
1
1
1
1
1
1
1
1
1
1
1
1
1
1
1
1
1
1
1
1
1
1
1
1
1
1
1
1
1
1
1
1
1
1
1
1
1
1
1
1
1
1
1
1
1
1
1
1
1
1
1
1
1
1
1
1
1
1
1
1
1
1
1
1
1
1
1
1
1
1
1
1
1
1
1
1
1
1
1
1
1
1
1
1
1
1
1
1
1
1
1
1
1
1
1
1
1
1
1
1
1
1
1
1
1
1
1
1
1
1
1
1
1
1
1
1
1
1
1
1
1
1
1
1
1
1
1
1
1
1
1
1
1
1
1
1
1
1
1
1
1
1
1
1
1
1
1
1
1
1
1
1
1
1
1
1
1
1
1
1
1
1
1
1
1
1
1
1
1
1
1
1
1
1
1
1
1
1
1
1
1
1
1
1
1
1
1
1
1
1
1
1
1
1
1
1
1
1
1
1
1
1
1
1
1
1
1
1
1
1
1
1
1
1
1
1
1
1
1
1
1
1
1
1
1
1
1
1
1
1
1
1
1
1
1
1
1
1
1
1
1
1
1
1
1
1
1
1
1
1
1
1
1
1
1
1
1
1
1
1
1
1
1
1
1
1
1
1
1
1
1
1
1
1
1
1
1
1
1
1
1
1
1
1
1
1
1
1
1
1
1
1
1
1
1
1
1
1
1
1
1
1
1
1
1
1
1
1
1
1
1
1
1
1
1
1
1
1
1
1
1
1
1
1
1
1
1
1
1
1
1
1
1
1
1
1
1
1
1
1
1
1
1
1
1
1
1
1
1
1
1
1
1
1
1
1
1
1
1
1
1
1
1
1
1
1
1
1
1
1
1
1
1
1
1
1
1
1
1
1
1
1
1
1
1
1
1
1
1
1
1
1
1
1
1
1
1
1
1
1
1
1
1
1
1
1
1
1
1
1
1
1
1
1
1
1
1
1
1
1
1
1
1
1
1
1
1
1
1
1
1
1
1
1
1
1
1
1
1
1
1
1
1
1
1
1
1
1
1
1
1
1
1
1
1
1
1
1
1
1
1
1
1
1
1
1
1
1
1
1
1
1
1
1
1
1
1
1
1
1
1
1
1
1
1
1
1
1
1
1
1
1
1
1
1
1
1
1
1
1
1
1
1
1
1
1
1
1
1
1
1
1
1
1
1
1
1
1
1
1
1
1
1
1
1
1
1
1
1
1
1
1
1
1
1
1
1
1
1
1
1
1
1
1
1
1
1
1
1
1
1
1
1
1
1
1
1
1
1
1
1
1
1
1
1
1
1
1
1
1
1
1
1
1
1
1
1
1
1
1
1
1
1
1
1
1
1
1
1
1
1
1
1
1
1
1
1
1
1
1
1
1
1
1
1
1
1
1
1
1
1
1
1
1
1
1
1
1
1
1
1
1
1
1
1
1
1
1
1
1
1
1
1
1
1
1
1
1
1
1
1
1
1
1
1
1
1
1
1
1
1
1
1
1
1
1
1
1
1
1
1
1
1
1
1
1
1
1
1
1
1
1
1
1
1
1
1
1
1
1
1
1
1
1
1
1
1
1
1
1
1
1
1
1
1
1
1
1
1
1
1
1
1
1
1
1
1
1
1
1
1
1
1
1
1
1
1
1
1
1
1
1
1
1
1
1
1
1
1
1
1
1
1
1
1
1
1
1
1
1
1
1
1
1
1
1
1
1
1
1
1
1
1
1
1
1
1
1
1
1
1
1
1
1
1
1
1
1
1
1
1
1
1
1
1
1
1
1
1
1
1
1
1
1
1
1
1
1
1
1
1
1
1
1
1
1
1
1
1
1
1
1
1
1
1
1
1
1
1
1
1
1
1
1
1
1
1
1
1
1
1
1
1
1
1
1
1
1
1
1
1
1
1
1
1
1
1
1
1
1
1
1
1
1
1
1
1
1
1
1
1
1
1
1
1
1
1
1
1
1
1
1
1
1
1
1
1
1
1
1
1
1
1
1
1
1
1
1
1
1
1
1
Publication Years
1
1297
2197
219
4
1
1
Category
1534
192
165
165
158
41
16
2
Toolboxes
560
419
192
147
126
100
93
86
84
82
71
69
63
63
62
58
57
50
39
31
30
28
16
15
5
2
Nice multilingual information brochure for refugee women arriving in Germany/Bremen. Includes Information on:
- Learn German
- Education & Employment
- Healthcare & Pregnancy
- Protection against Violence
- Asylum for Women
- Conversation and Contacts in the City
All chapters are translated i
...
nto german, english, kurmanji (kurdish), arabic, farsi, russian
more

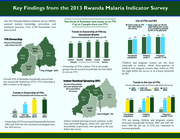
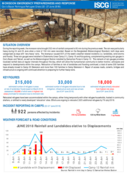
Key Findings (in booklet form) from the 2013 Rwanda Malaria Indicator Survey. The 2013 Rwanda Malaria Indicator Survey (RMIS) assessed malaria knowledge, prevention, and treatment practices. Over 4,700 households were interviewed.
DHS Further Analysis Reports No. 109 - This report documents trends in key child nutrition indicators in Rwanda. Data from the Demographic and Health Surveys (DHS) in 2005, 2010, and 2014-15 were analyzed, disaggregated by selected equity-related variables, and tested for trends. Over the survey per
...
iod, Rwanda had high rates of exclusive breastfeeding, with regional variation. Rates of continued breastfeeding were also high but generally decreased as mother’s education and household wealth increased in all survey years. Complementary feeding practices varied by region, mother’s education, household wealth, urban-rural residence, and sex of the child.
more
DHS Further Analysis Reports No. 108 - This report examines levels, trends, and inequalities in maternal health in Rwanda from 2010 to 2014-15 among women age 15-49 with a recent birth. The analysis uses Demographic and Health Survey (DHS) data for 15 key indicators of maternal health: 6 for antenat
...
al care, 3 for delivery, 1 for postnatal care, and 5 for barriers to accessing medical care. Levels and trends in these indicators were analyzed overall and by three background characteristics: women’s education, household wealth quintile, and region.
more
DHS Further Analysis Reports No. 107 - This report, based largely on the 2014-15 national survey in Rwanda, focuses on changes and trends in reproductive behavior since 2010. In the 4-5 years after the 2010 survey, fertility continued its decline to 4.2 births per woman as contraceptive prevalence i
...
ncreased slightly. However, the earlier downward trend in number of children desired appears stalled. This is clearly evident from an increase in the proportions of married women and men who say they want more children. Child mortality has significantly declined and remains strongly related to fertility; while age at marriage has continued to increase. The demographic goals specified in the 1998-99 plan for development, Rwanda Vision 2020, appear on track, but the annual rate of population growth remains high, currently 2.5%, because fertility is high. Furthermore, large numbers of young people are now entering their child-bearing years. Although most trends seem encouraging, especially compared with other countries in sub-Saharan Africa, significant population growth is expected in Rwanda, from 12 to 16 million people by 2030, and to 22 million people by mid-century, even with assumed reductions of fertility.
more
HIV Knowledge and Risky Sexual Behavior among Men in Rwanda
Rugigana, Etienne, Francine Birungi, and Manassé Nzayirambaho
Rockville, Maryland, USA: ICF International
(2014)
C2
DHS Working Papers No. 105 - Rwanda has developed and implemented many strategies at the national level to reduce the incidence of HIV in the general population. One of the main objectives of such interventions is to improve the general level of knowledge of HIV, with the hypothesis that increasing
...
HIV knowledge will reduce risky sexual behavior. However, there has been a concern that HIV knowledge may not necessarily reduce risky sexual behavior. Only a limited number of population-based studies describe the results of these interventions in terms of how HIV knowledge affects risky sexual behavior. Therefore, the aim of this paper is to fill in this gap, by exploring HIV knowledge and its effect on risky sexual behavior among men in Rwanda.
more
Measuring the Success of Family Planning Initiatives in Rwanda: A Multivariate Decomposition Analysis.
uhoza, Dieudonné Ndaruhuye, Pierre Claver Rutayisire, and Aline Umubyeyi.
Calverton, Maryland, USA: ICF International
(2013)
C2
DHS Working Papers No. 94 - This study described the family planning initiatives in Rwanda and analyzed the 2005 and 2010 RDHS data to identify factors that contribute to the increase in contraceptive use. The Blinder-Oaxaca technique was used to decompose the contributions of women’s characterist
...
ics and their effects.
more
Levels and Inequities
DHS Further Analysis Reports No. 110
This study shows large variations in maternal health indicators across high-priority counties in Kenya. Nairobi exceeds the national average on all maternal health indicators in this study, while other highpriority counties consist ... ently are disadvantaged compared with Kenya as a whole in most maternal health indicators. Kisumu exceeds the national average in use of antenatal care, delivery in a health facility, and postnatal care, but not other indicators. Nakuru has fewer women with fertility risk and fewer women who report that the distance they must travel to reach a health facility is a problem.
This study identifies a number of inequities in maternal health indicators across socio-demographic characteristics in the high-priority counties—most in the distribution of delivery care and least in antenatal care. Inequities are also observed in fertility risk and postnatal care. more
DHS Further Analysis Reports No. 111
This study is a theory-driven analysis of the socio-demographic determinants of maternal care seeking in Kenya. Specifically, it examines predisposing, enabling, and need factors potentially associated with use of antenatal care (ANC), health facility delive ... ry, and timely postnatal care (PNC).
This study uses data from the 2014 Kenya Demographic and Health Survey (KDHS) conducted among women age 15-49 with a live birth in the five years preceding the survey. It includes data from all 47 counties of Kenya, grouped contiguously into 12 regions. We apply Andersen’s Behavioral Model of Health Services Use to examine socio-demographic predictors of health service use. We estimate logistic regression models for adequate use of ANC (defined as attending at least four ANC visits, starting in the first three months of pregnancy), delivery in a health facility, and PNC within 48 hours of delivery. more
DHS Methodological Report No. 20
This study used Service Provision Assessment (SPA) and Demographic and Health Survey (DHS) data from Haiti, Malawi, and Tanzania to compare traditionally used additive methods with a data reduction method—principal component analysis (PCA).
We scored ... the quality of health facilities with three approaches (simple additive, weighted additive, and PCA) for two constructs: quality of services, with only facilities-level data, and quality of care, which incorporates observation and client data. We ranked facilities as high, medium, or low quality based on their scores. Our results indicated that the rankings change with the scoring methodology. There was more consistency in the rankings of facilities by the simple additive and PCA methods than the weighted additive and PCA-based rankings. This may be due to the low factor loadings and little variance explained by the first component in the PCA. We aggregated facility scores to their respective DHS clusters (Haiti, Malawi) or regions (Tanzania) and geographically linked them to women interviewed in DHS surveys to test associations between the use of family planning services and the quality environment, as measured with each index. more
The Rwandan Health Sector Research Policy (HSRP) policy defines the scope of research in the Rwandan health sector and presents the strategic principles to ensure that the research done in Rwandan health sector will be conducted in a more coordinated manner, promoting research for equity and social
...
justice and to benefit the Rwandan community as well as the global community in general. The health sector research policy provides solutions to the challenges which have been identified in health research. It will support and improve Rwanda’s health research environment and create a space and framework in which health research will grow and support improved health outcomes in Rwanda. It gives a clear orientation for dissemination and use of results. For sustainability of health research in Rwanda, foreign researchers are called upon to collaborate with Rwandans with clear capacity building plans.
more
Update - 27 June 2018
During the reporting week, the monsoon rains brought 252 mm of rainfall compared to 95 mm during the previous week. The downpour caused 65% of the week’s weather-related incidents (i.e. landslides, wind-storms and floods). Three rain gauges were installed in Chakmarkul ( ... near Camp 21), Camp 16 and Kutupalong, complementing existing rain gauges in Cox’s Bazar and Teknaf, as well as the Meteorological Station installed by Samaritan Purse in Camp 12. This network of rain gauges provides localized rainfall data at regular intervals throughout the day, which will allow the humanitarian community to better monitor, anticipate and respond to developments within the camps. Relocation of families at risk of landslides and flooding continued; a total of some 200 families have already moved to Camp 20 Extension and more than 100 families to Camp Extension 4. Repair of access roads, culverts, bridges and infrastructure is ongoing with continued attention to preparing for further heavy rains. more
During the reporting week, the monsoon rains brought 252 mm of rainfall compared to 95 mm during the previous week. The downpour caused 65% of the week’s weather-related incidents (i.e. landslides, wind-storms and floods). Three rain gauges were installed in Chakmarkul ( ... near Camp 21), Camp 16 and Kutupalong, complementing existing rain gauges in Cox’s Bazar and Teknaf, as well as the Meteorological Station installed by Samaritan Purse in Camp 12. This network of rain gauges provides localized rainfall data at regular intervals throughout the day, which will allow the humanitarian community to better monitor, anticipate and respond to developments within the camps. Relocation of families at risk of landslides and flooding continued; a total of some 200 families have already moved to Camp 20 Extension and more than 100 families to Camp Extension 4. Repair of access roads, culverts, bridges and infrastructure is ongoing with continued attention to preparing for further heavy rains. more
IAEA Safety Standards for protecting people and the environment
Flood Disaster Risk Management - Hydrological Forecasts: Requirements and Best Practices (Training Module)
Vogelbacher, A.
National Institute of Disaster Management (NIDM), Deutsche Gesellschaft für Internationale Zusammenarbeit (GIZ)
(2013)
C1
This Case Study explores flood forecasting systems from the perspective of its position within the flood warning process. A method for classifying the different approaches taken in flood forecasting is introduced before the elements of a present-day flood forecasting system are discussed in detail.
...
Finally, the state of the art in developing flood forecasting systems is addressed including how to deal with specific challenges posed.
The target group of this case study are decision makers in disaster risk management and/or water management. The case study should help to understand some hydrologic basics of the flood forecast and assist in the administration and implementation of an appropriate flood warning system in a specific environment, to find the best solution for a region.
Best solutions depend mainly on quality and availability of data, the areas and/or points of interest, catchment properties, cross border catchments, and financial capabilities with special consideration of flood forecast. more
Quantification des intrants de santé : supplément SRMNI - Prévision de la consommation de produits sélectionnés pour la santé reproductive, maternelle, néonatale et infantile
JSI Research & Training Institute, Inc., et Management Sciences for Health
JSI Research & Training Institute, Inc., et Management Sciences for Health
(2016)
C1
Soumis à l’Agence des États-Unis pour le développement international par le programme SIAPS (Systems for Improved Access to Pharmaceuticals and Services ou Programme des systèmes pour l’amélioration de l’accès aux produits et services pharmaceutiques). Arlington, VA : Management Sciences
...
for Health. Soumis à l’UNICEF par JSI, Arlington, VA : JSI Research & Training Institute, Inc.
Ce guide aidera les gestionnaires de programmes, les prestataires de service et les experts techniques lorsqu'ils réaliseront une quantification des besoins en intrants pour les 13 produits indispensables à la santé reproductive, maternelle, néonatale et infantile, dont la priorité a été établie par la Commission des Nations Unies pour les produits qui sauvent la vie des femmes et des enfants. Ce supplément à la quantification ne saurait être utilisé sans son guide principal – Quantification of Health Commodities: A Guide to Forecasting and Supply Planning for Procurement (Quantification des intrants de santé : un guide pour la prévision des achats et la planification des approvisionnements). * Ce supplément décrit les étapes à suivre pour la prévision de la consommation de ces intrants, en l’absence de données sur la consommation ou les services. Ensuite, afin de compléter la quantification, les utilisateurs doivent se référer au guide principal de quantification pour l’étape de planification de l’approvisionnement.
more
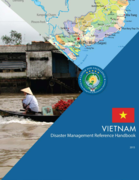
The National Strategy for Natural Disaster, Prevention, Response and Mitigation to 2020, which outlines Vietnam’s main disaster risk management objectives and the National Target Program (NTP) form the overarching policy framework for disaster risk management and climate change adaption activities
...
. The CCFSC’s main mandate is to translate this strategy into action. Other decrees and laws are also complementary. The Government of Vietnam has prioritized disaster preparedness, recognizing that the most cost-effective measures to mitigate flood related disasters are often non-structural. These measures include flood mapping, river flood warning systems, television-based disaster information and warning systems, training at all government and grassroots levels on disaster preparedness, and reforestation of certain areas. Land use and development have also been addressed through government regulations.
more