Filter
1128
Text search:
charts
Featured
118
337
Language
Document type
651
139
136
73
65
29
13
10
4
4
2
2
Countries
100
46
34
32
32
32
30
30
25
22
19
18
17
17
15
15
14
13
11
10
9
9
8
7
7
7
6
6
6
6
6
5
5
4
4
4
4
4
4
4
3
3
3
3
3
2
2
2
2
2
2
2
1
1
1
1
1
1
1
1
1
1
1
1
1
1
1
1
1
1
1
1
1
1
1
1
1
1
Authors & Publishers
Publication Years
Category
520
111
109
75
70
62
9
Toolboxes
66
65
52
44
36
33
30
27
27
22
21
20
17
17
17
17
15
11
11
9
8
8
4
4
1
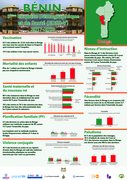
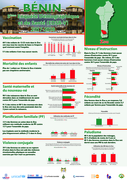
12 Departmental Wall Charts

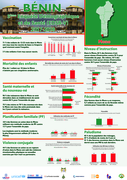
12 Departmental Wall Charts
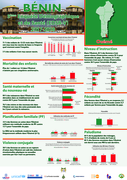
12 Departmental Wall Charts
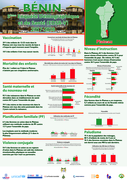
12 Departmental Wall Charts
12 Departmental Wall Charts
12 Departmental Wall Charts
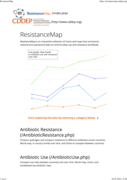
ResitanceMap
recommended
ResistanceMap is an interactive collection of charts and maps that summarize national and subnational data on antimicrobial use and resistance worldwide.
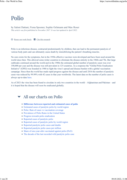
Here you can download different charts about cases by world region, prevalence rates, and progress towards polio eradication and much more.
Polio is an infectious disease that is caused and transmitted by the poliovirus. Most infections do not le
...
The International Very Preterm Size at Birth Reference Charts. Head circumference (cm) Girls
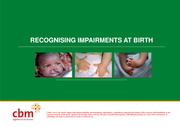
Preventing Physical Impairment in Childhood CBM Strategy Overview | Laminated flip charts | These are the main implementing tools in the prevention program, developed as A4 sized booklets which can be carried easily. They constitute the basic inform
...
War in Ukraine
recommended
On this page we provide a list of charts, data and resources that you may find useful to understand the context of the ongoing war in Ukraine.
On this page we provide an overview of excess mortality along with charts to explore the data. You can learn in more depth about different measures of excess mortality, their strengths and limitations, and their comparability across countries
In 2014 UNICEF, WHO and the World Bank report new joint estimates of child malnutrition using available data up to 2013 The Interactive dashboard allows users to generate a variety of graphs and charts, using the newest joint estimates of prevalence
...
Explore the latest data on nutrition at global, regional and country level, with interactive charts that let you see what progress your country has made towards the global nutrition targets.
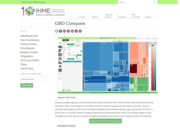
Global Burden of Disease (GBD) Compare
recommended
Analyze updated data about the world’s health levels and trends from 1990 to 2016 in this interactive tool. Use treemaps, maps, arrow diagrams, and other charts to compare causes and risks within a country, compare countries with regions or the wo
...
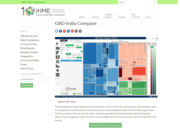
Global Burden of Disease (GBD) India Compare
recommended
Analyze data about India’s health levels and trends from 1990 to 2016 in this interactive tool. Use treemaps, maps, arrow diagrams, and other charts to compare causes and risks and explore patterns and trends by age and sex. Drill from a national
...
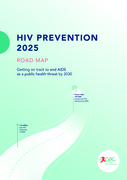
Getting on track to end AIDS as a public health threat by 2030. This new Road Map charts a way forward for country-level actions to achieve an ambitious set of HIV prevention targets by 2025. Those targets emerged from the 2021 Political Declaration
...
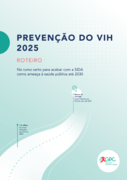
No rumo certo para acabar com a SIDA como ameaca à saúde pública até 2030. This new Road Map charts a way forward for country-level actions to achieve an ambitious set of HIV prevention targets by 2025. Those targets emerged from the 2021 Politi
...
A guide to management in Primary Health Care. A practical, instructive training guide that has proven its capacity to improve the managerial skills of middle-level health workers responsible for the management or supervision of health services. Presented as an activity-centered working guide, the bo
...
The IMCI model handbook provides a detailed explanation of the IMCI case management guidelines. It is organized into seven main parts: overview of the IMCI process; assess and classify the sick child age 2 months up to 5 years; assess and classify the sick young infant age 1 week up to 2 months; ide
...