Filter
2034
Text search:
Demographic
surveys
Featured
97
773
Language
1922
83
30
17
6
6
5
4
2
1
1
1
1
1
1
Document type
1366
395
98
63
58
14
14
12
11
3
Countries
115
94
91
80
79
75
65
64
61
61
58
55
53
53
52
48
42
34
31
27
27
27
23
21
20
20
19
19
17
17
16
16
14
12
12
11
10
10
9
9
8
8
8
7
7
6
6
6
6
5
5
5
5
5
5
4
4
4
4
4
4
3
3
3
3
3
3
3
2
2
2
2
2
2
2
2
2
2
2
2
2
2
1
1
1
1
1
1
1
1
1
1
1
1
1
1
1
1
1
1
1
1
1
1
1
1
Authors & Publishers
166
55
55
55
50
41
34
34
32
28
28
24
20
16
16
14
13
12
12
11
10
9
9
8
8
8
8
7
7
7
7
7
7
7
7
6
6
6
6
6
6
5
5
5
5
5
5
5
5
5
5
5
5
5
5
5
5
5
5
5
5
5
5
5
5
5
4
4
4
4
4
4
4
4
4
4
4
4
4
4
4
4
4
4
4
4
4
4
4
4
4
3
3
3
3
3
3
3
3
3
3
3
3
3
3
3
3
3
3
3
3
3
3
3
3
3
3
3
3
3
3
3
3
3
3
3
3
3
3
3
3
3
3
3
3
3
3
3
3
3
3
2
2
2
2
2
2
2
2
2
2
2
2
2
2
2
2
2
2
2
2
2
2
2
2
2
2
2
2
2
2
2
2
2
2
2
2
2
2
2
2
2
2
2
2
2
2
2
2
2
2
2
2
2
2
2
2
2
2
2
2
2
2
2
2
2
2
2
2
2
2
2
2
2
2
2
2
2
2
2
2
2
2
2
2
2
2
2
2
2
2
2
2
2
2
2
2
2
2
2
2
2
2
2
2
2
2
2
2
2
2
2
2
2
2
2
2
2
2
2
2
2
2
2
2
2
2
2
2
2
2
2
2
2
2
2
2
2
2
2
2
2
2
2
2
2
2
2
2
2
2
2
2
2
2
2
1
1
1
1
1
1
1
1
1
1
1
1
1
1
1
1
1
1
1
1
1
1
1
1
1
1
1
1
1
1
1
1
1
1
1
1
1
1
1
1
1
1
1
1
1
1
1
1
1
1
1
1
1
1
1
1
1
1
1
1
1
1
1
1
1
1
1
1
1
1
1
1
1
1
1
1
1
1
1
1
1
1
1
1
1
1
1
1
1
1
1
1
1
1
1
1
1
1
1
1
1
1
1
1
1
1
1
1
1
1
1
1
1
1
1
1
1
1
1
1
1
1
1
1
1
1
1
1
1
1
1
1
1
1
1
1
1
1
1
1
1
1
1
1
1
1
1
1
1
1
1
1
1
1
1
1
1
1
1
1
1
1
1
1
1
1
1
1
1
1
1
1
1
1
1
1
1
1
1
1
1
1
1
1
1
1
1
1
1
1
1
1
1
1
1
1
1
1
1
1
1
1
1
1
1
1
1
1
1
1
1
1
1
1
1
1
1
1
1
1
1
1
1
1
1
1
1
1
1
1
1
1
1
1
1
1
1
1
1
1
1
1
1
1
1
1
1
1
1
1
1
1
1
1
1
1
1
1
1
1
1
1
1
1
1
1
1
1
1
1
1
1
1
1
1
1
1
1
1
1
1
1
1
1
1
1
1
1
1
1
1
1
1
1
1
1
1
1
1
1
1
1
1
1
1
1
1
1
1
1
1
1
1
1
1
1
1
1
1
1
1
1
1
1
1
1
1
1
1
1
1
1
1
1
1
1
1
1
1
1
1
1
1
1
1
1
1
1
1
1
1
1
1
1
1
1
1
1
1
1
1
1
1
1
1
1
1
1
1
1
1
1
1
1
1
1
1
1
1
1
1
1
1
1
1
1
1
1
1
1
1
1
1
1
1
1
1
1
1
1
1
1
1
1
1
1
1
1
1
1
1
1
1
1
1
1
1
1
1
1
1
1
1
1
1
1
1
1
1
1
1
1
1
1
1
1
1
1
1
1
1
1
1
1
1
1
1
1
1
1
1
1
1
1
1
1
1
1
1
1
1
1
1
1
1
1
1
1
1
1
1
1
1
1
1
1
1
1
1
1
1
1
1
1
1
1
1
1
1
1
1
1
1
1
1
1
1
1
1
1
1
1
1
1
1
1
1
1
1
1
1
1
1
1
1
1
1
1
1
1
1
1
1
1
1
1
1
1
1
1
1
1
1
1
1
1
1
1
1
1
1
1
1
1
1
1
1
1
1
1
1
1
1
1
1
1
1
1
1
1
1
1
1
1
1
1
1
1
1
1
1
1
1
1
1
1
1
1
1
1
1
1
1
1
1
1
1
1
1
1
1
1
1
1
1
1
1
1
1
1
1
1
1
1
1
1
1
1
1
1
1
1
1
1
1
1
1
1
1
1
1
1
1
1
1
1
1
1
1
1
1
1
1
1
1
1
1
1
1
1
1
1
1
1
1
1
1
1
1
1
1
1
1
1
1
1
1
1
1
1
1
1
1
1
1
1
1
1
1
1
1
1
1
1
1
1
1
1
1
1
1
1
1
1
1
1
1
1
1
1
1
1
1
1
1
1
1
1
1
1
1
1
1
1
1
1
1
1
1
1
1
1
1
1
1
1
1
1
1
1
1
1
1
1
1
1
1
1
1
1
1
1
1
1
1
1
1
1
1
1
1
1
1
1
1
1
1
1
1
1
1
1
1
1
1
1
1
1
1
1
1
1
1
1
1
1
1
1
1
1
1
1
1
1
1
1
1
1
1
1
1
1
1
1
1
1
1
1
1
1
1
1
1
1
1
1
1
1
1
1
1
1
1
1
1
1
1
1
1
1
1
1
1
1
1
1
1
1
1
1
1
1
1
1
1
1
1
1
1
1
1
1
1
1
1
1
1
1
1
1
1
1
1
1
1
1
1
1
1
1
1
1
1
1
1
1
1
1
1
1
1
1
1
1
1
1
1
1
1
1
1
1
1
1
1
1
1
1
1
1
1
1
1
1
1
1
1
1
1
1
1
1
1
1
1
1
1
1
1
1
1
1
1
1
1
1
1
1
1
1
1
1
1
1
1
1
1
1
1
1
1
1
1
1
1
1
1
1
1
1
1
1
1
1
1
1
1
1
1
1
1
1
1
1
1
1
1
1
1
1
1
1
1
1
1
1
1
1
1
1
1
1
1
1
1
1
1
1
1
1
1
1
1
1
1
1
1
1
1
1
1
1
1
1
1
1
1
1
1
1
1
1
1
1
1
1
1
1
1
1
1
1
1
1
1
1
1
1
1
1
1
1
1
1
1
1
1
1
1
1
1
1
1
1
1
1
1
1
1
1
1
1
1
1
1
1
1
1
1
1
1
1
1
1
1
1
1
1
1
1
1
1
1
1
1
1
1
1
1
1
1
1
1
1
1
1
1
1
1
1
1
1
1
1
1
1
1
1
1
1
1
1
1
1
1
1
1
1
1
1
1
1
1
1
1
1
1
1
1
1
1
1
1
1
1
1
1
1
1
1
1
1
1
1
1
1
1
1
1
1
1
1
1
1
1
1
1
1
1
1
1
1
1
1
1
1
1
1
1
1
1
1
1
1
1
1
1
1
1
1
1
1
1
1
1
1
1
1
1
1
1
1
1
1
1
1
1
1
1
1
1
1
1
1
1
1
1
1
1
1
1
1
1
1
1
1
1
1
1
1
1
1
1
1
1
1
1
1
1
1
1
1
1
1
1
1
1
1
1
1
1
1
1
1
1
1
1
1
1
1
1
1
1
1
1
1
1
1
1
1
1
1
1
1
1
1
1
1
1
1
1
1
1
1
1
1
1
1
1
1
1
1
1
1
1
1
1
1
1
1
1
1
1
1
1
1
1
1
1
1
1
1
1
1
1
1
1
1
1
1
1
1
1
1
1
1
1
1
1
1
1
1
1
1
1
1
1
1
1
1
1
1
1
1
1
1
1
1
1
1
1
1
1
1
1
1
1
1
1
1
1
1
1
1
1
1
1
1
1
1
1
1
1
1
1
1
1
1
1
1
1
1
1
1
1
1
1
1
1
1
1
1
1
1
1
1
1
1
1
1
1
1
1
1
1
1
1
1
1
1
1
1
1
1
1
1
1
1
1
1
1
1
1
1
1
1
1
1
1
1
1
1
1
1
1
1
1
1
1
1
1
1
1
1
1
1
1
1
1
1
1
1
1
1
1
1
1
1
1
1
1
1
1
1
1
1
1
1
1
1
1
1
1
1
1
1
1
1
1
1
1
1
1
1
1
1
1
1
1
1
1
1
1
1
1
1
1
1
1
1
1
1
1
1
1
1
1
1
1
1
1
1
1
1
1
1
1
1
1
1
1
1
1
1
1
1
1
1
1
1
1
1
1
1
1
1
1
1
1
1
1
1
1
1
1
1
1
1
1
1
1
1
1
1
1
1
1
1
1
1
1
1
1
1
1
1
1
1
1
1
1
1
1
1
1
1
1
1
1
1
1
1
1
1
1
1
1
1
1
1
Publication Years
412
1460
157
3
2
Category
1277
121
109
95
63
11
5
Toolboxes
101
74
66
57
51
47
44
43
37
37
32
22
20
19
17
16
16
14
14
8
7
4
3
3
1
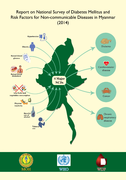
The Ministry of Health conducted STEPS surveys on adult risk factors surveillance in Myanmar in 2003, 2009 and 2014. Amongst these three surveys, the 2014 one is the most comprehensive, providing an
...
analysis of all States and Regions within Myanmar through not only questionnaires and physical measurements – STEPs 1 and 2 of the survey – but also with data obtained through biochemical measurements (STEP 3).
The STEPS survey was initiated by the Ministry of Health in December 2014 with the technical support of WHO Headquarters, regional and country offices. more
The STEPS survey was initiated by the Ministry of Health in December 2014 with the technical support of WHO Headquarters, regional and country offices. more
Survey report
Four health surveys were performed in Kutupalong Makeshift Settlment (KMS), Balukhali Makeshift Settlement (BMS), Kutupalong Makeshift Settlement Extension (KMS Extension) and Balukhali Makeshift Settlement Extension (BMS Extension) ... . These sites were chosen to ensure that the health status and conditions were measured in both the new settlements and the pre-existing settlements. The surveys measured current and retrospective mortality, the main morbidities affecting the population, global and severe acute malnutrition rates, vaccination coverage rates for key antigens and health-seeking behaviour. Simple random sampling was used with a recall period from 25th February 2017 until the date of interview (30th October to 12th November): approximately 260 days. more
Four health surveys were performed in Kutupalong Makeshift Settlment (KMS), Balukhali Makeshift Settlement (BMS), Kutupalong Makeshift Settlement Extension (KMS Extension) and Balukhali Makeshift Settlement Extension (BMS Extension) ... . These sites were chosen to ensure that the health status and conditions were measured in both the new settlements and the pre-existing settlements. The surveys measured current and retrospective mortality, the main morbidities affecting the population, global and severe acute malnutrition rates, vaccination coverage rates for key antigens and health-seeking behaviour. Simple random sampling was used with a recall period from 25th February 2017 until the date of interview (30th October to 12th November): approximately 260 days. more

India is experiencing rapid demographic and epidemiological transitions with NCDs causing significant disability, morbidity and mortality both in urban and rural populations and across all socioeconomic strata. According to the ICMR State Level Dise
...
ase Burden Initiative, in 2016, NCDs accounted to an estimated 6.0 million deaths, constituting 62% of the total mortality of that year.
more
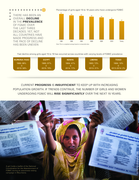
This brochure draws on data from more than 90 nationally representative surveys making it the most up-to-date compilation of statistics on FGM/C. Available data show that the practice of FGM/C is highly concentrated in a swath of countries from the
...
Atlantic coast to the Horn of Africa, in areas of the Middle East such as Iraq and Yemen and in some countries in Asia like Indonesia. However, FGM/C is a human rights issue that affects girls and women worldwide. Evidence suggests that FGM/C exists in some places in South America such as Colombia and elsewhere in the world including in India, Malaysia, Oman, Saudi Arabia, and the United Arab Emirates.
more
UNICEF’s support for data collection: the Multiple Indicator Cluster Surveys (MICS)
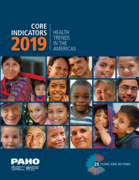
Core Indicators 2019: Health Trends in the Americas starts with a demographic overview of the Americas to demonstrate how the Region has changed over 25 years. These key demographic indicators provi
...
de valuable context to better understand the population’s characteristics and their impact on health. Brief narratives accompany the graphics to highlight important information.
more
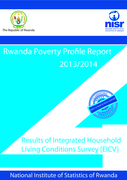
This report provides an update on the level of poverty based on 2013/14 Integrated Household Living Conditions Survey (EICV4) focusing on poverty as measured in consumption terms. The report also highlights other trend dimensions of living conditions captured in other
...
surveys that complement and provide a holistic understanding of poverty and living conditions.
Rwanda’s economy has been growing steadily at about 8% since 2001 with GDP per capita more than tripling from US$ 211 in 2001 to US$ 718 in 2014. Food crop production growth was more than twice that of population growth between 2007 and 2014.
more
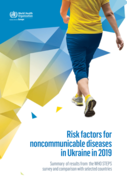
This document summarizes the findings of the STEPS survey in Ukraine and compares them with the results of STEPS surveys carried out in other countries in the WHO European Region, as well as with selected other
...
surveys in Ukraine. The survey is designed to be repeated approximately every five years in each country to allow assessment of trends.
The study revealed very high prevalence of NCDs and their behavioural and biological risk factors in Ukraine. Data on behavioural risk factors include tobacco and alcohol use, diet, and physical activity. Data on biological risk factors include overweight and obesity, blood pressure, blood glucose, and blood lipid levels.
more
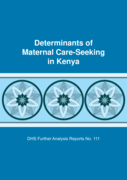
DHS Further Analysis Reports No. 111
This study is a theory-driven analysis of the socio-demographic determinants of maternal care seeking in Kenya. Specifically, it examines predisposing, enabling, and need factors potentially associated with ... use of antenatal care (ANC), health facility delivery, and timely postnatal care (PNC).
This study uses data from the 2014 Kenya Demographic and Health Survey (KDHS) conducted among women age 15-49 with a live birth in the five years preceding the survey. It includes data from all 47 counties of Kenya, grouped contiguously into 12 regions. We apply Andersen’s Behavioral Model of Health Services Use to examine socio-demographic predictors of health service use. We estimate logistic regression models for adequate use of ANC (defined as attending at least four ANC visits, starting in the first three months of pregnancy), delivery in a health facility, and PNC within 48 hours of delivery. more

Access to Services and Barriers faced by People with Disabilities: A Quantitative Survey
Nathan Grills, Lawrence Singh, Hira Pant, Jubin Varghese, GVS Murthy, Monsurul Hoq, Manjula Marella
Disability, CBR & Inclusive Development Journal (DCIDJ)
(2017)
CC
In low- and middle-income middle-income countries, reliable and disaggregated disability data on prevalence, participation and barriers are often unavailable. This study aimed to estimate disability prevalence, determine associated socio-demographic
...
factors and compare access in the community between people with and without disability in Dehradun district of Uttarakhand, India, using the Rapid Assessment of Disability survey.
more
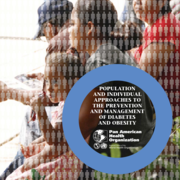
Obesity and diabetes are affecting the peoples of the Americas at high and increasing rates. National surveys demonstrate that obesity is increasing in prevalence among all age groups; 7% to 12% of children under 5 years old and
one-fi fth of adole
...
scents are obese, while rates of overweight and obesity among adults approach 60%. Obesity is the major modifi able risk factor for diabetes.
more
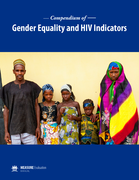
The intended purpose of this compendium is to provide program managers, organizations, and policy makers with a menu of indicators to better “know their HIV epidemic/know their response” from a gender perspective. The indicators in the compendium are all either part of existing indicators used i
...
n studies or by countries or have been adapted from existing indicators to address the intersection of gender and HIV. The indicators can be measured through existing data collection and information systems (e.g. routine program monitoring, surveys) in most country contexts, though some may require special studies or research.
more
This first in a series of Washington Group Implementation Documents covers the tools developed by the Washington Group to collect
internationally comparable disability data on censuses and surveys. WG Implementation guideline Tool 1
Journal of Biosocial Science / Volume 34 / Issue 04 / October 2002, pp 525 - 539
DOI: DOI:10.1017/S0021932002005254, Published online: 24 September 2002
This paper examines determinants of one aspect of sexual behaviour – coital frequency – among 2188 married women in the Central African Re
...
public using a secondary analysis of data from the Demographic and Health Survey of 1994–95. Female genital cutting (or circumcision) is practised in the Central African Republic and self-reported circumcision status was included in the questionnaire enabling it to be examined as a possible determinant of coital frequency. Multiple logistic regression was used to find a subset of factors independently associated with coital frequency.
Decreased coital frequency was found in those who had longer duration of marriage, those who were not the most recent wife in a polygamous marriage and those who had more surviving children. Coital frequency was higher in more educated women and those not contracepting because they wanted to get pregnant. After adjusting for confounders no association between
female genital cutting and coital frequency was found. The extent to which women can control coital frequency in this culture is not known and fertility desires may override any negative effects of circumcision on sexual pleasure.
It was therefore not possible to draw conclusions about how female genital cutting affects a woman’s desire for sexual intercourse and consequently there is a need to develop research methods further to investigate this question.
more
This briefing note summarizes work undertaken by UN Women and WHO to inform the development of a module on violence against women 60 years and older that can be included in dedicated surveys on violence against women. It provides an overview of the
...
challenges in the availability, measurement, and collection of data on violence against older women. It also makes recommendations to address some of the issues identified, with the aim of strengthening ongoing and future data collection efforts on violence against older women and increasing its availability.
Developed as part of the UN Women–WHO Global Joint Programme on Violence Against Women Data, this methodological briefing note is one in a series that aims to strengthen the measurement and data collection of violence against particular groups of women or specific aspects of violence against women. These briefing notes are meant for researchers, national statistics offices, and others involved in data collection on violence against women. They seek to contribute to strengthening the quality and availability of data on violence against women and enhance global, regional, and national level monitoring of progress towards its elimination.
more
This document presents the findings of the National Census of Persons with Disabilities in Rwanda. The preliminary result of this census has been used to produce a summary analysis of tables and figures. It shall be possible to derive basic socio-demograph
...
ic indicators as well as to obtain the estimate of persons with disability in Rwanda, all of which shall serve as a reference to the categorization activity planned to be done in the near future by a medical committee from the Ministry of Health. The data of this report relate to (1) Persons with disability size for various administrative units (Districts and Provinces), (2) Distribution of Persons with disabilities by sex, age, marital status and type of disabilities.
more
Biobehavioural Survey Guidelines - For Populations at risk for HIV
A. Abdul-Quader; M. Berry; T. Bingham; J. Burnett; et al.
Centers for Diseases Control and Prevention; UNAIDS; World Health Organization; et al.
(2017)
C_WHO
The guidelines fill a gap in providing tools for surveying HIV prevalence in key populations, and the included questionnaires may also inform general population surveys. These guidelines standardize the conduct of biobehavioural
...
surveys to permit comparisons between as well as within countries over time.
You can download supplementary material from this website
more

Background Unrest in Chile over inequalities has underscored the need to improve public hospitals. Nursing has been overlooked as a solution to quality and access concerns, and nurse staffing is poor by international standards. Using Chile’s new diagnosis-related groups system and
...
surveys of nurses and patients, we provide information to policy makers on feasibility, net costs, and estimated improved outcomes associated with increasing nursing resources in public hospitals.
more
A series of data syntheses from the RCCE Collective Service. It focuses on public perceptions of the COVID-19 vaccinations, bringing together 66 data sources from quantitative surveys across 107 countries and six regions, underpinned by a rapid revi
...
ew of additional studies and community feedback data from Africa.
more

Recency assays use one or more biomarkers to identify whether HIV infection in a person is recent (usually within a year or less) or longstanding. Recency assays have been used to estimate incidence in representative cross-sectional surveys and in e
...
pidemiological studies to better understand the patterns and distributions of new and longstanding HIV infections.
This technical guidance outlines best practices regarding the appropriate use of HIV recency assays for surveillance purposes and updates 2011 technical guidance from the World Health Organization (WHO) and the Joint United Nations Programme on HIV/AIDS (UNAIDS) on the use of HIV recency assays.
more