Filter
338
Text search:
infographic
Featured
53
71
Language
Document type
115
102
29
29
18
16
8
7
6
5
2
1
Countries
16
14
11
10
6
5
5
4
4
3
3
3
3
3
3
3
3
2
2
2
2
2
2
2
2
2
2
2
2
2
2
2
2
2
2
2
2
2
2
1
1
1
1
1
1
1
1
1
1
1
1
1
1
1
1
1
1
1
1
1
1
1
1
1
1
1
1
1
1
Authors & Publishers
Publication Years
Category
95
26
23
7
4
4
2
Toolboxes
86
30
22
16
15
14
13
13
11
10
10
10
10
8
7
5
4
4
3
3
1
1
1
Infographic for General Public
Infographic
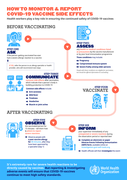
Health workers play a key role in ensuring the continued safety of COVID-19 vaccines
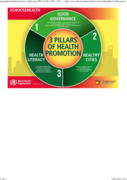
This is a infographic for health promotion: 3 Pillars of health promotion
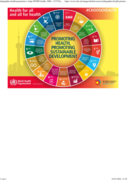
This is a infographic for health promotion: Promoting health, promoting sustainable development
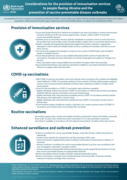
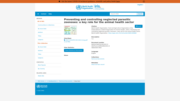
Infographic: Preventing and controlling neglected parasitic zoonoses: a key role for the animal health sector
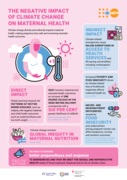
This infographic looks at how climate change directly and indirectly impacts maternal health, making pregnancy less safe and worsening neonatal health outcomes.
Infographic (30 Oct. 2022)
Infographic
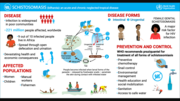
Disease: Infection is widespread in poor communities, 221 million people affected worldwide...
Affected Populations: Women, Children...
Prevention and Control: WHO recommends praziquantel for treatment of all forms of schistosomiasis.
...

Infographic about Filariasis - WHO
Fold-out - Pamphlet
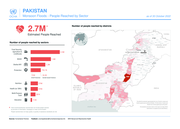
map/infographic
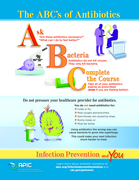
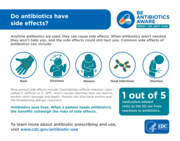
This infographic from APIC helps patients and families better understand their role in preventing infections and includes a list of questions to ask their healthcare provider about antibiotics.
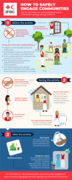
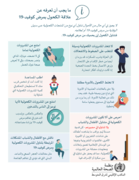
An infographic providing tips on how to safely engage with communities while conducting face-to-face meetings during COVID-19.
This infographic provides important information on what to do and what not to do in regard to alcohol during the COVID-19 pandemic, including: avoiding alcohol altogether, reaching out for help, avoiding alcohol as a social cue for smoking, discussi
...
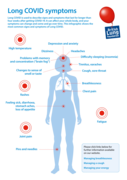
This infographic shows the most common signs and symptoms of Long COVID. Breathlessness. Cough, sore throat. Chest pain. Pins and needles. Tinnitus, earaches.
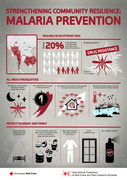
This infographic poster provides key information on the prevention, transmission and control of malaria in Southeast Asia. It highlights regional challenges, the behaviour of malaria vectors, and community-based strategies to build resilience agains
...
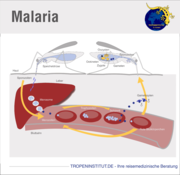
This infographic from the Tropeninstitut illustrates the malaria transmission cycle. It begins when an Anopheles mosquito bites a human and injects its sporozoites into the bloodstream. The sporozoites then travel to the liver where they mature and
...
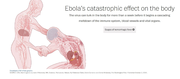
Very good infographic included in this article: The virus can lurk in the body for more than a week before it begins a cascading meltdown of the immune system, blood vessels and vital organs.
Please download from the website link in the article.
...
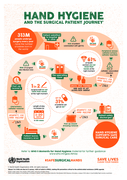
Hand Hygiene Infographic
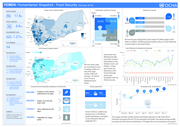
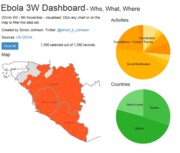
Please find the latest interactive infographic on the websitehttp://www.humanitarianresponse.info/fr/operations/west-and-central-africa/infographies-interactives. Click any chart or on the map to filter the data set