Filter
4184
Text search:
household
population
Featured
333
1351
Language
4044
101
64
40
39
23
20
9
6
5
4
3
3
3
2
2
2
2
2
2
2
2
2
2
1
1
1
1
1
1
1
1
1
1
1
1
1
1
1
1
1
1
1
1
1
1
Document type
2482
758
396
183
182
68
48
45
7
6
6
2
1
Countries
184
175
169
131
124
120
118
110
104
96
90
89
84
80
73
71
70
69
53
51
50
45
45
43
43
43
42
39
37
36
36
34
31
31
28
26
23
22
19
19
19
18
17
16
15
15
15
15
15
14
13
13
13
12
11
11
11
11
10
10
10
9
9
9
8
8
7
7
7
7
6
5
5
5
5
4
4
4
4
4
3
3
3
3
3
3
3
2
2
2
2
2
2
2
2
2
2
2
2
2
2
2
2
2
2
2
2
2
1
1
1
1
1
1
1
1
1
1
1
1
1
1
1
1
1
1
1
1
1
1
1
1
1
1
1
Authors & Publishers
392
138
120
112
101
83
75
55
54
46
33
29
26
24
24
23
19
19
18
18
18
17
17
16
16
15
15
15
15
14
14
14
13
13
13
13
13
13
13
13
13
13
13
12
12
12
12
11
11
11
11
11
11
11
11
10
10
10
10
10
9
9
9
9
9
9
9
9
8
8
8
8
8
8
7
7
7
7
7
7
7
7
7
7
6
6
6
6
6
6
6
6
6
6
6
6
6
6
6
6
6
6
6
6
6
5
5
5
5
5
5
5
5
5
5
5
5
5
5
5
5
5
5
5
5
5
5
5
5
5
5
5
5
5
5
5
5
5
5
5
5
4
4
4
4
4
4
4
4
4
4
4
4
4
4
4
4
4
4
4
4
4
4
4
4
4
4
4
4
4
4
4
4
4
4
4
4
4
4
4
4
4
4
4
4
4
3
3
3
3
3
3
3
3
3
3
3
3
3
3
3
3
3
3
3
3
3
3
3
3
3
3
3
3
3
3
3
3
3
3
3
3
3
3
3
3
3
3
3
3
3
3
3
3
3
3
3
3
3
3
3
3
3
3
3
3
3
3
3
3
3
3
3
3
3
3
3
3
3
3
3
3
3
3
3
3
3
3
3
3
3
3
3
3
3
3
3
3
3
3
3
3
3
2
2
2
2
2
2
2
2
2
2
2
2
2
2
2
2
2
2
2
2
2
2
2
2
2
2
2
2
2
2
2
2
2
2
2
2
2
2
2
2
2
2
2
2
2
2
2
2
2
2
2
2
2
2
2
2
2
2
2
2
2
2
2
2
2
2
2
2
2
2
2
2
2
2
2
2
2
2
2
2
2
2
2
2
2
2
2
2
2
2
2
2
2
2
2
2
2
2
2
2
2
2
2
2
2
2
2
2
2
2
2
2
2
2
2
2
2
2
2
2
2
2
2
2
2
2
2
2
2
2
2
2
2
2
2
2
2
2
2
2
2
2
2
2
2
2
2
2
2
2
2
2
2
2
2
2
2
2
2
2
2
2
2
2
2
2
2
2
2
2
2
2
2
2
2
2
2
2
2
2
2
2
2
2
2
2
2
2
2
2
2
2
2
2
2
2
2
2
2
2
2
2
2
2
2
2
2
2
2
2
2
2
2
2
2
2
2
2
2
2
2
2
2
2
2
2
2
2
2
2
2
2
2
2
2
2
2
2
2
2
2
2
2
2
2
2
2
2
2
1
1
1
1
1
1
1
1
1
1
1
1
1
1
1
1
1
1
1
1
1
1
1
1
1
1
1
1
1
1
1
1
1
1
1
1
1
1
1
1
1
1
1
1
1
1
1
1
1
1
1
1
1
1
1
1
1
1
1
1
1
1
1
1
1
1
1
1
1
1
1
1
1
1
1
1
1
1
1
1
1
1
1
1
1
1
1
1
1
1
1
1
1
1
1
1
1
1
1
1
1
1
1
1
1
1
1
1
1
1
1
1
1
1
1
1
1
1
1
1
1
1
1
1
1
1
1
1
1
1
1
1
1
1
1
1
1
1
1
1
1
1
1
1
1
1
1
1
1
1
1
1
1
1
1
1
1
1
1
1
1
1
1
1
1
1
1
1
1
1
1
1
1
1
1
1
1
1
1
1
1
1
1
1
1
1
1
1
1
1
1
1
1
1
1
1
1
1
1
1
1
1
1
1
1
1
1
1
1
1
1
1
1
1
1
1
1
1
1
1
1
1
1
1
1
1
1
1
1
1
1
1
1
1
1
1
1
1
1
1
1
1
1
1
1
1
1
1
1
1
1
1
1
1
1
1
1
1
1
1
1
1
1
1
1
1
1
1
1
1
1
1
1
1
1
1
1
1
1
1
1
1
1
1
1
1
1
1
1
1
1
1
1
1
1
1
1
1
1
1
1
1
1
1
1
1
1
1
1
1
1
1
1
1
1
1
1
1
1
1
1
1
1
1
1
1
1
1
1
1
1
1
1
1
1
1
1
1
1
1
1
1
1
1
1
1
1
1
1
1
1
1
1
1
1
1
1
1
1
1
1
1
1
1
1
1
1
1
1
1
1
1
1
1
1
1
1
1
1
1
1
1
1
1
1
1
1
1
1
1
1
1
1
1
1
1
1
1
1
1
1
1
1
1
1
1
1
1
1
1
1
1
1
1
1
1
1
1
1
1
1
1
1
1
1
1
1
1
1
1
1
1
1
1
1
1
1
1
1
1
1
1
1
1
1
1
1
1
1
1
1
1
1
1
1
1
1
1
1
1
1
1
1
1
1
1
1
1
1
1
1
1
1
1
1
1
1
1
1
1
1
1
1
1
1
1
1
1
1
1
1
1
1
1
1
1
1
1
1
1
1
1
1
1
1
1
1
1
1
1
1
1
1
1
1
1
1
1
1
1
1
1
1
1
1
1
1
1
1
1
1
1
1
1
1
1
1
1
1
1
1
1
1
1
1
1
1
1
1
1
1
1
1
1
1
1
1
1
1
1
1
1
1
1
1
1
1
1
1
1
1
1
1
1
1
1
1
1
1
1
1
1
1
1
1
1
1
1
1
1
1
1
1
1
1
1
1
1
1
1
1
1
1
1
1
1
1
1
1
1
1
1
1
1
1
1
1
1
1
1
1
1
1
1
1
1
1
1
1
1
1
1
1
1
1
1
1
1
1
1
1
1
1
1
1
1
1
1
1
1
1
1
1
1
1
1
1
1
1
1
1
1
1
1
1
1
1
1
1
1
1
1
1
1
1
1
1
1
1
1
1
1
1
1
1
1
1
1
1
1
1
1
1
1
1
1
1
1
1
1
1
1
1
1
1
1
1
1
1
1
1
1
1
1
1
1
1
1
1
1
1
1
1
1
1
1
1
1
1
1
1
1
1
1
1
1
1
1
1
1
1
1
1
1
1
1
1
1
1
1
1
1
1
1
1
1
1
1
1
1
1
1
1
1
1
1
1
1
1
1
1
1
1
1
1
1
1
1
1
1
1
1
1
1
1
1
1
1
1
1
1
1
1
1
1
1
1
1
1
1
1
1
1
1
1
1
1
1
1
1
1
1
1
1
1
1
1
1
1
1
1
1
1
1
1
1
1
1
1
1
1
1
1
1
1
1
1
1
1
1
1
1
1
1
1
1
1
1
1
1
1
1
1
1
1
1
1
1
1
1
1
1
1
1
1
1
1
1
1
1
1
1
1
1
1
1
1
1
1
1
1
1
1
1
1
1
1
1
1
1
1
1
1
1
1
1
1
1
1
1
1
1
1
1
1
1
1
1
1
1
1
1
1
1
1
1
1
1
1
1
1
1
1
1
1
1
1
1
1
1
1
1
1
1
1
1
1
1
1
1
1
1
1
1
1
1
1
1
1
1
1
1
1
1
1
1
1
1
1
1
1
1
1
1
1
1
1
1
1
1
1
1
1
1
1
1
1
1
1
1
1
1
1
1
1
1
1
1
1
1
1
1
1
1
1
1
1
1
1
1
1
1
1
1
1
1
1
1
1
1
1
1
1
1
1
1
1
1
1
1
1
1
1
1
1
1
1
1
1
1
1
1
1
1
1
1
1
1
1
1
1
1
1
1
1
1
1
1
1
1
1
1
1
1
1
1
1
1
1
1
1
1
1
1
1
1
1
1
1
1
1
1
1
1
1
1
1
1
1
1
1
1
1
1
1
1
1
1
1
1
1
1
1
1
1
1
1
1
1
1
1
1
1
1
1
1
1
1
1
1
1
1
1
1
1
1
1
1
1
1
1
1
1
1
1
1
1
1
1
1
1
1
1
1
1
1
1
1
1
1
1
1
1
1
1
1
1
1
1
1
1
1
1
1
1
1
1
1
1
1
1
1
1
1
1
1
1
1
1
1
1
1
1
1
1
1
1
1
1
1
1
1
1
1
1
1
1
1
1
1
1
1
1
1
1
1
1
1
1
1
1
1
1
1
1
1
1
1
1
1
1
1
1
1
1
1
1
1
1
1
1
1
1
1
1
1
1
1
1
1
1
1
1
1
1
1
1
1
1
1
1
1
1
1
1
1
1
1
1
1
1
1
1
1
1
1
1
1
1
1
1
1
1
1
1
1
1
1
1
1
1
1
1
1
1
1
1
1
1
1
1
1
1
1
1
1
1
1
1
1
1
1
1
1
1
1
1
1
1
1
1
1
1
1
1
1
1
1
1
1
1
1
1
1
1
1
1
1
1
1
1
1
1
1
1
1
1
1
1
1
1
1
1
1
1
1
1
1
1
1
1
1
1
1
1
1
1
1
1
1
1
1
1
1
1
1
1
1
1
1
1
1
1
1
1
1
1
1
1
1
1
1
1
1
1
1
1
1
1
1
1
1
1
1
1
1
1
1
1
1
1
1
1
1
1
1
1
1
1
1
1
1
1
1
1
1
1
1
1
1
1
1
1
1
1
1
1
1
1
1
1
1
1
1
1
1
1
1
1
1
1
1
1
1
1
1
1
1
1
1
1
1
1
1
1
1
1
1
1
1
1
1
1
1
1
1
1
1
1
1
1
1
1
1
1
1
1
1
1
1
1
1
1
1
1
1
1
1
1
1
1
1
1
1
1
1
1
1
1
1
1
1
1
1
1
1
1
1
1
1
1
1
1
1
1
1
1
1
1
1
1
1
1
1
1
1
1
1
1
1
1
1
1
1
1
1
1
1
1
1
1
1
1
1
1
1
1
1
1
1
1
1
1
1
1
1
1
1
1
1
1
1
1
1
1
1
1
1
1
1
1
1
1
1
1
1
1
1
1
1
1
1
1
1
1
1
1
1
1
1
1
1
1
1
1
1
1
1
1
1
1
1
1
1
1
1
1
1
1
1
1
1
1
1
1
1
1
1
1
1
1
1
1
1
1
1
1
1
1
1
1
1
1
1
1
1
1
1
1
1
1
1
1
1
1
1
1
1
1
1
1
1
1
1
1
1
1
1
1
1
1
1
1
1
1
1
1
1
1
1
1
1
1
1
1
1
1
1
1
1
1
1
1
1
1
1
1
1
1
1
1
1
1
1
1
1
1
1
1
1
1
1
1
1
1
1
1
1
1
1
1
1
1
1
1
1
1
1
1
1
1
1
1
1
1
1
1
1
1
1
1
1
1
1
1
1
1
1
1
1
1
1
1
1
1
1
1
1
1
1
1
1
1
1
1
1
1
1
1
1
1
1
1
1
1
1
1
1
1
1
1
1
1
1
1
1
1
1
1
1
1
1
1
1
1
1
1
1
1
1
1
1
1
1
1
1
1
1
1
1
1
1
1
1
1
1
1
1
1
1
1
1
1
1
1
1
1
1
1
1
1
1
1
1
1
1
1
1
1
1
1
1
1
1
1
1
1
1
1
1
1
1
1
1
1
1
1
1
1
1
1
1
1
1
1
1
1
1
1
1
1
1
1
1
1
1
1
1
1
1
1
1
1
1
1
1
1
1
1
1
1
1
1
1
1
1
1
1
1
1
1
1
1
1
1
1
1
1
1
1
1
1
1
1
1
1
1
1
1
1
1
1
1
1
1
1
1
1
1
1
1
1
1
1
1
1
1
1
1
1
1
1
1
1
1
1
1
1
1
1
1
1
1
1
1
1
1
1
1
1
1
1
1
1
1
1
1
1
1
1
1
1
1
1
1
1
1
1
1
1
1
1
1
1
1
1
1
1
1
1
1
1
1
1
1
1
1
1
1
1
1
1
1
1
1
1
1
1
1
1
1
1
1
1
1
1
1
1
1
1
1
1
1
1
1
1
1
1
1
1
1
1
1
1
1
1
1
1
1
1
1
1
1
1
1
1
1
1
1
1
1
1
1
1
1
1
1
1
1
1
1
1
1
1
1
1
1
1
1
1
1
1
1
1
1
1
1
1
1
1
1
1
1
1
1
1
1
1
1
1
1
1
1
1
1
1
1
1
1
1
1
1
1
1
1
1
1
1
1
1
1
1
1
1
1
1
1
1
1
1
1
1
1
1
1
1
1
1
1
1
1
1
1
1
1
1
1
1
1
1
1
1
1
1
1
1
1
1
1
1
1
1
1
1
1
1
1
1
1
1
1
1
1
1
1
1
1
1
1
1
1
1
1
1
1
1
1
1
1
1
1
1
1
1
1
1
1
1
1
1
1
1
1
1
1
1
1
1
1
1
1
1
1
1
1
1
1
1
1
1
1
1
1
1
1
1
1
1
1
1
1
1
1
1
1
1
1
1
1
1
1
1
1
1
1
1
1
1
1
1
1
1
1
1
1
1
1
1
1
1
1
1
1
1
1
1
1
1
1
1
1
1
1
1
1
1
1
1
1
1
1
1
1
1
1
1
1
1
1
1
1
1
1
1
1
1
1
1
1
1
1
1
1
1
1
1
1
1
1
1
1
1
1
1
1
1
1
1
1
1
1
1
1
1
1
1
1
1
1
1
1
1
1
1
1
1
1
1
1
1
1
1
1
1
1
1
1
1
1
1
1
1
1
1
1
1
1
1
1
1
1
1
1
1
1
1
1
1
1
1
1
1
1
1
1
1
1
1
1
1
1
1
1
1
1
1
1
1
1
1
1
1
1
1
1
1
1
1
1
1
1
1
1
1
1
1
1
1
1
1
1
1
1
1
1
1
1
1
1
1
1
1
1
1
1
1
1
1
1
1
1
1
1
1
1
1
1
1
1
1
1
1
1
1
1
1
1
1
1
1
1
1
1
1
1
1
1
1
1
1
1
1
1
1
1
1
1
1
1
1
1
1
1
1
1
1
1
1
1
1
1
1
1
1
1
1
1
1
1
1
1
1
1
1
1
1
1
1
1
1
1
1
1
1
1
1
1
1
1
1
1
1
1
1
1
1
1
1
1
1
1
1
1
1
1
1
1
1
1
1
1
1
1
1
1
1
1
1
1
1
1
1
1
1
1
1
1
1
1
1
1
1
1
1
1
1
1
1
1
1
1
1
1
1
1
1
1
1
1
1
1
1
1
1
1
1
1
1
1
1
1
1
1
1
1
1
1
1
1
1
1
1
1
1
1
1
1
1
1
1
1
1
1
1
1
1
1
1
1
1
1
1
1
1
1
1
1
1
1
1
1
1
1
1
1
1
1
1
1
1
1
1
1
1
1
1
1
1
1
1
1
1
1
1
1
1
1
1
1
1
1
1
1
1
1
1
1
1
1
1
1
1
1
1
1
1
1
1
1
1
1
1
1
1
1
1
1
1
1
1
1
1
1
1
1
1
1
1
1
1
1
1
1
1
1
1
1
1
1
1
1
1
1
1
1
1
1
1
1
1
1
1
1
1
1
1
1
1
1
1
1
1
1
1
1
1
1
1
1
1
1
1
1
1
1
1
1
1
1
1
1
1
1
1
1
1
1
1
1
1
1
1
1
1
1
1
1
1
1
1
1
1
1
1
1
1
1
1
1
1
1
1
1
1
1
1
1
1
1
1
1
1
1
1
1
1
1
1
1
1
1
1
1
1
1
1
1
1
1
1
1
1
1
1
1
1
1
1
1
1
1
1
1
1
1
1
1
1
1
1
1
1
1
1
1
1
1
1
1
1
1
1
1
1
1
1
1
1
1
1
1
1
1
1
1
1
1
1
1
1
1
1
1
1
1
1
1
1
1
1
1
1
1
1
1
1
1
1
1
1
1
1
1
1
1
1
1
1
1
1
1
1
1
1
1
1
1
1
1
1
1
1
1
1
1
1
1
1
1
1
1
1
1
1
1
1
1
1
1
1
1
1
1
1
1
1
1
1
1
1
1
1
1
1
1
1
Publication Years
1159
2673
344
7
1
Category
2049
307
221
189
168
68
12
Toolboxes
326
218
199
197
191
168
131
103
95
86
70
67
63
60
58
49
42
41
39
37
31
27
24
9
5
4
2

In 2018, the Food and Agriculture Organization of the United Nations (FAO) in South Sudan must respond to the highest levels of food insecurity ever recorded in the country. To address this challenge, FAO revised its multiyear Emergency Livelihood Response Programme (ELRP) to enable rapid food produ
...
ction among the most vulnerable communities, protect their livelihoods and reduce dependency on humanitarian aid while building their resilience.
more
Evidence-to-Decision and Grade tables
The 2007 Rwanda Service Provision Assessment (RSPA) was a national representative survey conducted in 538 health facilities throughout Rwanda. The survey covered hospitals, health centers, dispensaries and
health posts, including all public facilities such as government and government-assisted heal
...
th facilities. The 2007 RSPA used interviews with health service providers and clients and observations of provider client consultations to obtain information on the capacity of facilities to provide quality services and the existence of functioning systems to support quality services. The areas addressed were the overall facility
infrastructure, maternal and child health, reproductive health, tuberculosis, malaria services; and services for sexually transmitted infections and HIV/AIDS. The objective was to assess the strengths and
weaknesses of the infrastructure and systems supporting these services, and to assess the adherence to standards in the delivery of services.
more
This report investigates the impact of potential misclassification of samples on HIV prevalence estimates for 23 surveys conducted from 2010-2014. In addition to visual inspection of laboratory results, we examined how accounting for potential misclassification of HIV status through Bayesian latent
...
class models affected the prevalence estimates. Two types of Bayesian models were specified: a model that only uses the individual dichotomous test results and a continuous model that uses the quantitative information of the EIA (i.e., the signal-to-cutoff values). Overall, we found that adjusted prevalence estimates matched the surveys’ original results, with overlapping uncertainty intervals. This suggested that misclassification of HIV status should not affect the prevalence estimates in most surveys. However, our analyses suggested that two surveys may be problematic. The prevalence could have been overestimated in the Uganda AIDS Indicator Survey 2011 and the Zambia Demographic and Health Survey 2013-14, although the magnitude of overestimation remains difficult to ascertain. Interpreting results from the Uganda survey is difficult because of the lack of internal quality control and potential violation of the multivariate normality assumption of the continuous Bayesian latent class model. In conclusion, despite the limitations of our latent class models, our analyses suggest that prevalence estimates from most of the surveys reviewed are not affected by sample misclassification.
more
2016 revision

Detection, Confirmation and Management of a Dysentery Outbreak caused by Shigella Dysenteriae type 1
Standard Operating Procedures | RBC/IHDPC/EID Division | 9/30/2011
Levels and Inequities
DHS Further Analysis Reports No. 110
This study shows large variations in maternal health indicators across high-priority counties in Kenya. Nairobi exceeds the national average on all maternal health indicators in this study, while other highpriority counties consist ... ently are disadvantaged compared with Kenya as a whole in most maternal health indicators. Kisumu exceeds the national average in use of antenatal care, delivery in a health facility, and postnatal care, but not other indicators. Nakuru has fewer women with fertility risk and fewer women who report that the distance they must travel to reach a health facility is a problem.
This study identifies a number of inequities in maternal health indicators across socio-demographic characteristics in the high-priority counties—most in the distribution of delivery care and least in antenatal care. Inequities are also observed in fertility risk and postnatal care. more
DHS Further Analysis Reports No. 111
This study is a theory-driven analysis of the socio-demographic determinants of maternal care seeking in Kenya. Specifically, it examines predisposing, enabling, and need factors potentially associated with use of antenatal care (ANC), health facility delive ... ry, and timely postnatal care (PNC).
This study uses data from the 2014 Kenya Demographic and Health Survey (KDHS) conducted among women age 15-49 with a live birth in the five years preceding the survey. It includes data from all 47 counties of Kenya, grouped contiguously into 12 regions. We apply Andersen’s Behavioral Model of Health Services Use to examine socio-demographic predictors of health service use. We estimate logistic regression models for adequate use of ANC (defined as attending at least four ANC visits, starting in the first three months of pregnancy), delivery in a health facility, and PNC within 48 hours of delivery. more
DHS Methodological Report No. 20
This study used Service Provision Assessment (SPA) and Demographic and Health Survey (DHS) data from Haiti, Malawi, and Tanzania to compare traditionally used additive methods with a data reduction method—principal component analysis (PCA).
We scored ... the quality of health facilities with three approaches (simple additive, weighted additive, and PCA) for two constructs: quality of services, with only facilities-level data, and quality of care, which incorporates observation and client data. We ranked facilities as high, medium, or low quality based on their scores. Our results indicated that the rankings change with the scoring methodology. There was more consistency in the rankings of facilities by the simple additive and PCA methods than the weighted additive and PCA-based rankings. This may be due to the low factor loadings and little variance explained by the first component in the PCA. We aggregated facility scores to their respective DHS clusters (Haiti, Malawi) or regions (Tanzania) and geographically linked them to women interviewed in DHS surveys to test associations between the use of family planning services and the quality environment, as measured with each index. more
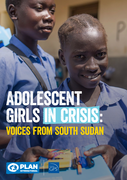
In the last 5 years, the conflict in South Sudan has displaced 4 million people and placed 7 million in need of humanitarian assistance.
This report commissioned by Plan International draws on research conducted with girls and members of their families and communities in multiple sites in South ... Sudan and Uganda.
It explores how adolescent girls within two age brackets (aged 10-14 and 15-19) understand and respond to the unique impact their country’s crisis has upon them.
It seeks to amplify their voices and their perceptions of the crisis and presents their views on how the humanitarian sector might respond. more


Breastfeeding
The goal of this contingency plan for El Nino related epidemics is to contribute to the reduction in mortality and morbidity associated with El Nino epidemic threats by ensuring that appropriate systems to support health emergency preparedness, timely response and post disaster recovery and mitigati
...
on are in place at the national, district, health facility and community levels in Rwanda.
more
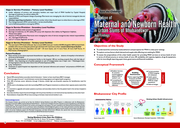
Objectives of the Study:
To understand the community needs, behaviors and perception for MNH in urban poor settings.
To explore various factors (both demand and supply side) affecting care seeking for MNH.
To assess the preparedness of the urban health system for providing MNH services at variou
...
s levels of care in terms of infrastructures at various levels of care, HR availability and capacity, logistics, drugs & equipment, referral, recording & reporting, supervision, governance and financial modalities.
more
The aim of this report is to: (1) synthesize the findings from selected maternal and newborn related studies in Nepal conducted during 2011-2014, (2) identify areas of improvement in existing interventions, and (3) recommend possible strategies to fulfill such gaps.

Nepal has performed exceptionally in improving reproductive, maternal and child health outcomes over the past two decades. In this article, we discuss these achievements and outline a vision for the future of maternal, newborn and child survival in Nepal after the era of the Millennium Development G
...
oals. On the pathway towards quality universal health care services for all, we propose strengthening of health information systems, gradual health system reforms, improvement of existing facility based services, development of integrated service delivery models, improved technical and managerial capacity at district and facility levels. Elimination of all preventable causes of maternal, newborn and child deaths in Nepal should be our collective aspirational goal.
more
Nepal is on target to meet the Millennium Development Goals for maternal and child health despite high levels of poverty, poor infrastructure, difficult terrain and recent conflict. Each year, nearly 35000 Nepali children die before their fifth birthday, with almost two-thirds of these deaths occurr
...
ing in the first month of life, the neonatal period. As part of a multi-country analysis, we examined changes for newborn survival between 2000 and 2010 in terms of mortality, coverage and health system indicators as well as national and donor funding.
more