Filter
1950
Text search:
demographic
and
social
indicators
Featured
105
748
Language
1911
35
33
17
14
12
6
3
2
1
1
1
1
1
1
1
1
Document type
1277
360
120
86
68
13
11
10
3
1
1
Countries
103
87
86
79
74
71
65
63
60
59
54
54
53
48
45
41
35
32
27
27
26
25
25
23
22
21
19
17
15
13
12
11
11
11
10
10
10
10
9
8
8
8
7
7
7
7
7
6
5
5
5
5
5
4
4
4
4
4
4
3
3
3
3
3
3
3
3
3
2
2
2
2
2
2
2
2
2
2
2
2
2
1
1
1
1
1
1
1
1
1
1
1
1
1
1
1
1
1
1
1
1
1
1
1
1
1
1
1
1
1
1
1
Authors & Publishers
156
53
50
49
45
42
41
34
26
20
20
18
16
14
14
12
12
10
10
10
9
9
8
8
8
8
8
7
7
7
7
7
7
6
6
6
6
6
6
6
6
5
5
5
5
5
5
5
5
5
5
5
5
5
5
5
5
5
4
4
4
4
4
4
4
4
4
4
4
4
4
4
4
4
4
4
4
4
3
3
3
3
3
3
3
3
3
3
3
3
3
3
3
3
3
3
3
3
3
3
3
3
3
3
3
3
3
3
3
3
3
3
3
3
3
3
3
3
3
3
3
3
3
3
3
3
3
3
3
2
2
2
2
2
2
2
2
2
2
2
2
2
2
2
2
2
2
2
2
2
2
2
2
2
2
2
2
2
2
2
2
2
2
2
2
2
2
2
2
2
2
2
2
2
2
2
2
2
2
2
2
2
2
2
2
2
2
2
2
2
2
2
2
2
2
2
2
2
2
2
2
2
2
2
2
2
2
2
2
2
2
2
2
2
2
2
2
2
2
2
2
2
2
2
2
2
2
2
2
2
2
2
2
2
2
2
2
2
2
2
2
2
2
2
2
2
2
2
2
2
2
2
2
2
2
2
2
2
2
2
2
2
2
2
2
2
2
2
1
1
1
1
1
1
1
1
1
1
1
1
1
1
1
1
1
1
1
1
1
1
1
1
1
1
1
1
1
1
1
1
1
1
1
1
1
1
1
1
1
1
1
1
1
1
1
1
1
1
1
1
1
1
1
1
1
1
1
1
1
1
1
1
1
1
1
1
1
1
1
1
1
1
1
1
1
1
1
1
1
1
1
1
1
1
1
1
1
1
1
1
1
1
1
1
1
1
1
1
1
1
1
1
1
1
1
1
1
1
1
1
1
1
1
1
1
1
1
1
1
1
1
1
1
1
1
1
1
1
1
1
1
1
1
1
1
1
1
1
1
1
1
1
1
1
1
1
1
1
1
1
1
1
1
1
1
1
1
1
1
1
1
1
1
1
1
1
1
1
1
1
1
1
1
1
1
1
1
1
1
1
1
1
1
1
1
1
1
1
1
1
1
1
1
1
1
1
1
1
1
1
1
1
1
1
1
1
1
1
1
1
1
1
1
1
1
1
1
1
1
1
1
1
1
1
1
1
1
1
1
1
1
1
1
1
1
1
1
1
1
1
1
1
1
1
1
1
1
1
1
1
1
1
1
1
1
1
1
1
1
1
1
1
1
1
1
1
1
1
1
1
1
1
1
1
1
1
1
1
1
1
1
1
1
1
1
1
1
1
1
1
1
1
1
1
1
1
1
1
1
1
1
1
1
1
1
1
1
1
1
1
1
1
1
1
1
1
1
1
1
1
1
1
1
1
1
1
1
1
1
1
1
1
1
1
1
1
1
1
1
1
1
1
1
1
1
1
1
1
1
1
1
1
1
1
1
1
1
1
1
1
1
1
1
1
1
1
1
1
1
1
1
1
1
1
1
1
1
1
1
1
1
1
1
1
1
1
1
1
1
1
1
1
1
1
1
1
1
1
1
1
1
1
1
1
1
1
1
1
1
1
1
1
1
1
1
1
1
1
1
1
1
1
1
1
1
1
1
1
1
1
1
1
1
1
1
1
1
1
1
1
1
1
1
1
1
1
1
1
1
1
1
1
1
1
1
1
1
1
1
1
1
1
1
1
1
1
1
1
1
1
1
1
1
1
1
1
1
1
1
1
1
1
1
1
1
1
1
1
1
1
1
1
1
1
1
1
1
1
1
1
1
1
1
1
1
1
1
1
1
1
1
1
1
1
1
1
1
1
1
1
1
1
1
1
1
1
1
1
1
1
1
1
1
1
1
1
1
1
1
1
1
1
1
1
1
1
1
1
1
1
1
1
1
1
1
1
1
1
1
1
1
1
1
1
1
1
1
1
1
1
1
1
1
1
1
1
1
1
1
1
1
1
1
1
1
1
1
1
1
1
1
1
1
1
1
1
1
1
1
1
1
1
1
1
1
1
1
1
1
1
1
1
1
1
1
1
1
1
1
1
1
1
1
1
1
1
1
1
1
1
1
1
1
1
1
1
1
1
1
1
1
1
1
1
1
1
1
1
1
1
1
1
1
1
1
1
1
1
1
1
1
1
1
1
1
1
1
1
1
1
1
1
1
1
1
1
1
1
1
1
1
1
1
1
1
1
1
1
1
1
1
1
1
1
1
1
1
1
1
1
1
1
1
1
1
1
1
1
1
1
1
1
1
1
1
1
1
1
1
1
1
1
1
1
1
1
1
1
1
1
1
1
1
1
1
1
1
1
1
1
1
1
1
1
1
1
1
1
1
1
1
1
1
1
1
1
1
1
1
1
1
1
1
1
1
1
1
1
1
1
1
1
1
1
1
1
1
1
1
1
1
1
1
1
1
1
1
1
1
1
1
1
1
1
1
1
1
1
1
1
1
1
1
1
1
1
1
1
1
1
1
1
1
1
1
1
1
1
1
1
1
1
1
1
1
1
1
1
1
1
1
1
1
1
1
1
1
1
1
1
1
1
1
1
1
1
1
1
1
1
1
1
1
1
1
1
1
1
1
1
1
1
1
1
1
1
1
1
1
1
1
1
1
1
1
1
1
1
1
1
1
1
1
1
1
1
1
1
1
1
1
1
1
1
1
1
1
1
1
1
1
1
1
1
1
1
1
1
1
1
1
1
1
1
1
1
1
1
1
1
1
1
1
1
1
1
1
1
1
1
1
1
1
1
1
1
1
1
1
1
1
1
1
1
1
1
1
1
1
1
1
1
1
1
1
1
1
1
1
1
1
1
1
1
1
1
1
1
1
1
1
1
1
1
1
1
1
1
1
1
1
1
1
1
1
1
1
1
1
1
1
1
1
1
1
1
1
1
1
1
1
1
1
1
1
1
1
1
1
1
1
1
1
1
1
1
1
1
1
1
1
1
1
1
1
1
1
1
1
1
1
1
1
1
1
1
1
1
1
1
1
1
1
1
1
1
1
1
1
1
1
1
1
1
1
1
1
1
1
1
1
1
1
1
1
1
1
1
1
1
1
1
1
1
1
1
1
1
1
1
1
1
1
1
1
1
1
1
1
1
1
1
1
1
1
1
1
1
1
1
1
1
1
1
1
1
1
1
1
1
1
1
1
1
1
1
1
1
1
1
1
1
1
1
1
1
1
1
1
1
1
1
1
1
1
1
1
1
1
1
1
1
1
1
1
1
1
1
1
1
1
1
1
1
1
1
1
1
1
1
1
1
1
1
1
1
1
1
1
1
1
1
1
1
1
1
1
1
1
1
1
1
1
1
1
1
1
1
1
1
1
1
1
1
1
1
1
1
1
1
1
1
1
1
1
1
1
1
1
1
1
1
1
1
1
1
1
1
1
1
1
1
1
1
1
1
1
1
1
1
1
1
1
1
1
1
1
1
1
1
1
1
1
1
1
1
1
1
1
1
1
1
1
1
1
1
1
1
1
1
1
1
1
1
1
1
1
1
1
1
1
1
1
1
1
1
1
1
1
1
1
1
1
1
1
1
1
1
1
1
1
1
1
1
1
1
1
1
1
1
1
1
1
1
1
1
1
1
1
1
1
1
1
1
1
1
1
1
1
1
1
1
1
1
1
1
1
1
1
1
1
1
1
1
1
1
1
1
1
1
1
1
1
1
1
1
1
1
1
1
1
1
1
1
1
1
1
1
1
1
1
1
1
1
1
1
1
1
1
1
1
1
1
1
1
1
1
1
1
1
1
1
1
1
1
1
1
1
1
1
1
1
1
1
1
1
1
1
1
1
1
1
1
1
1
1
1
1
1
1
1
1
1
1
1
1
1
1
1
1
1
1
1
1
1
1
1
1
1
1
1
1
1
1
1
1
1
1
1
1
1
1
1
1
1
1
1
1
1
1
1
1
1
1
1
1
1
1
1
1
1
1
1
1
1
1
1
1
1
1
1
1
1
1
1
1
1
1
1
1
1
1
1
1
1
1
1
1
1
1
1
1
1
1
1
1
1
1
1
1
1
1
1
1
1
1
1
1
1
1
1
1
1
1
1
1
1
1
1
1
1
1
1
1
1
1
1
1
1
1
1
1
1
Publication Years
419
1358
170
2
1
Category
1205
109
102
102
55
14
5
Toolboxes
97
80
73
66
53
44
37
36
27
26
24
23
23
23
20
18
16
12
12
8
8
8
3
2
1
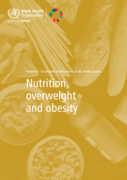
Unhealthy diets and excess body weight are leading risk factors for death and disability in the WHO European Region. Addressing malnutrition in all its forms is essential to ensure health
...
and well-being for all and, consequently, sustainable development. It requires coherent and innovative actions covering the entire food system and across other sectors to ensure access to a diversified, balanced and healthy diet for all.
more
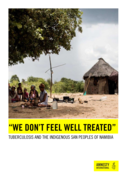
Tuberculosis (TB) is an infectious disease that usually affects the lungs, though it can affect any organ in the body. It can develop when bacteria spread through droplets in the air. TB can be fatal, but in many cases, TB is preventable and treatab
...
le. This report examines the human rights impact of the prevalence of Tuberculosis (TB) and Multi-drug-resistant tuberculosis (MDR-TB) among the Indigenous San peoples of Namibia. Combining political economy and root-cause methodology, the report explores the socioeconomic factors that make the San vulnerable to TB and limit their access to adequate health services.
more
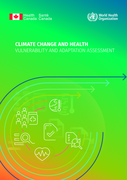
In 2013 the World Health Organization (WHO) published the report Protecting health from climate change:vulnerability and adaptation assessment. The aim was to provide basic and flexible guidance on
...
conducting national or subnational assessments of current and future vulnerability (the susceptibility of a population or region to harm) to the health risks of climate change, and of policies and programmes that could increase resilience, taking into account the multiple determinants of climate-sensitive health outcomes.
That guidance has been a very useful tool, applied to more than 50 countries and settings, and has helped countries to prepare their health contributions to United Nations Framework Convention on Climate Change national adaptation plans.
Since the launch of the guidance, WHO, technical partners such as Health Canada, and countries have learned much in terms of its applicability in different countries, at national and local levels.
At the same time, knowledge on climate change and health has increased.
WHO, the Pan American Health Organization and Health Canada have produced this updated version, which aims to better support countries in their assessments by proposing a simpler tool that incorporates
all lessons learned.
more
The revision of the SRHR Policy is based on the results of the analysis of the implementation process of the past policy, which has provided evidence to
ensure that the revised policy is relevant and effective. The revision has also been done with
...
the participation of all national stakeholders who have
also international experience on SRHR issues. The Ministry urges all public and private institutions to use this policy as a guide in the implementation of
SRHR services in the country.
more
WHO’s Country Cooperation Strategy (CCS) defines the Organization’s medium-term vision for working in and with a particular country. The CCS, developed in the context of global and national heal
...
th priorities, examines the overall health situation in a country, including the state of the health sector, socioeconomic status and the major health determinants.
This CCS sets out WHO’s strategic framework for collaboration with the Syrian Arab Republic, from June 2022 until June 2025, in light of the 12 years of crisis that have had a devastating impact on the health sector and infrastructure of basic services. It carefully considers the current and projected issues during its transition from continued humanitarian assistance to recovery, resilience and development. The consolidation of health policies and strategies and health system strengthening, based on the strengthening of primary health care (PHC), aims to contribute to the achievement of national and global development and health goals and the targets of the SDGs.
more
This report explores the extent to which evidence, policy, normative guidance and commitments on HIV and gender-based violence, and their interlink
...
ages, is being translated into action on the ground in fragile settings. These issues are explored through the lens of training of peace support operations deploying African troops across Africa and beyond.
more
Non-Communicable Diseases (NCDs) have emerged as conditions of great public health concern in Kenya accounting for 39% of deaths annually. The Ministry of Health through the Department of Non-Communicable Diseases has adopted the vision of achieving a nation free from preventable burden of NCDs. Fur
...
ther, the mission of this strategy is to halt and reverse the rising burden of NCDs through effective multisectoral collaboration and partnerships by ensuring Kenyans receive the highest attainable standard of NCD continuum of care that is accessible, affordable, quality, equitable and sustainable thus alleviating suffering, disease and death for their well-being and socio-economic development.
The scope of NCDs covered by this strategy include; cardiovascular diseases, cancer, diabetes, chronic respiratory diseases, mental health conditions, violence and injuries, hemoglobinopathies, haemophilia and other bleeding disorders, auto immune diseases, chronic renal diseases, epilepsy and other neurological disorders, chronic skin conditions and oral diseases and conditions. It equally addresses seven risk factors; tobacco use, harmful use of alcohol, unhealthy diets and toxins, physical inactivity, indoor air pollution, environmental pollutants and toxins and stress.
more
Early detection, assessment and response to acute public health events:
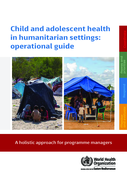
The approach is in line with two of the five objectives outlined in the Every Newborn Action Plan (ENAP): Strategic Objective 2 – Improve the quality of maternal and newborn care; and Strategic Ob
...
jective 5 – Count every newborn through measurement, programme-tracking and accountability to generate data for decision-making and action.
more
Revised edition
PLoS ONE 11(1): e0144662. doi:10.1371/journal.pone.0144662
The Second Economic Development and Poverty Reduction Strategy (EDPRS 2) is a launch into the home straight of our Vision 2020. We are faced with new challenges of ensuring greater self-reliance and
...
developing global competitiveness. Conscious of these challenges, we forge ahead knowing that by working together, we always overcome. The EDPRS 2 period is the time when our private sector is expected to take the driving seat in economic growth and poverty reduction. Through this strategy we will focus government efforts on transforming the economy, the private sector and alleviating constraints to growth of investment. We will develop the appropriate skills and competencies to allow our people particularly the youth to become more productive and competitive to support our ambitions. We will also strengthen the platform for communities to engage decisively and to continue to develop home grown solutions that have been the bedrock of our success. These are fundamental principles as we work to improve the lives of all Rwandans in the face of an uncertain global economic environment.
more
Recently, a renewed interest in large-scale community health worker (CHW) programs has been seen globally. This renewal provides an opportune moment to take stock of issues and challenges such programs face
...
and what can be done to make them as effective as possible. With this in mind, this manual is intended to be used a practical guide for policymakers and program
managers wishing to develop or strengthen a CHW program, drawing lessons from other countries that have implemented CHW programs at-scale. Throughout, we discuss major policy and programmatic issues that decision-makers and planners need to consider when designing, implementing, scaling up or strengthening a national-level CHW program. We offer an overview
of specific challenges CHW programs face, country lessons, tools, and other resources that may be helpful, while incorporating relevant programmatic examples as much as possible.
more
Lancet 2022; 399: 1155–200 Published Online March 15, 2022 https://doi.org/10.1016/
S0140-6736(21)02488-0
A Reference Guide for Program Managers and Policy Makers. Recently, a renewed interest in large-scale community health worker (CHW) programs has been seen globally. This renewal provides an opportune moment to take stock of issues
...
and challenges such programs face and what can be done to make them as effective as possible. With this in mind, this manual is intended to be used a practical guide for policymakers and program managers wishing to develop or strengthen a CHW program, drawing lessons from other countries that have implemented CHW programs at-scale
more