Filter
3505
Text search:
demographic
Featured
177
1203
Language
3334
115
59
29
17
17
13
11
7
2
1
1
1
1
1
1
1
1
1
1
1
Document type
2196
709
225
118
109
62
30
24
17
12
1
1
1
Countries
159
140
136
133
126
108
107
99
97
96
96
82
80
79
79
78
70
64
50
49
49
47
44
44
43
37
34
34
30
30
28
27
27
20
19
18
18
17
17
17
16
14
14
13
13
12
12
12
11
11
10
10
10
10
10
9
9
8
8
8
8
7
7
7
6
6
6
5
5
5
5
5
5
5
5
5
4
4
4
4
3
3
3
3
3
3
3
2
2
2
2
2
2
2
2
2
2
2
2
2
2
1
1
1
1
1
1
1
1
1
1
1
1
1
1
1
1
1
1
1
1
1
1
1
1
Authors & Publishers
311
100
97
89
76
69
62
55
45
37
32
29
24
24
21
19
18
18
16
16
16
15
14
13
13
13
13
13
12
12
12
12
12
11
11
10
10
10
9
9
9
9
9
9
9
9
8
8
8
8
8
8
7
7
7
7
7
7
7
7
7
7
7
7
7
6
6
6
6
6
6
6
6
6
6
6
6
6
6
5
5
5
5
5
5
5
5
5
5
5
5
5
5
5
5
5
5
5
5
5
5
5
5
5
5
5
5
4
4
4
4
4
4
4
4
4
4
4
4
4
4
4
4
4
4
4
4
4
4
4
4
4
4
4
4
4
4
4
4
4
4
4
4
4
4
4
4
4
4
3
3
3
3
3
3
3
3
3
3
3
3
3
3
3
3
3
3
3
3
3
3
3
3
3
3
3
3
3
3
3
3
3
3
3
3
3
3
3
3
3
3
3
3
3
3
3
3
3
3
3
3
3
3
3
3
3
3
3
3
3
3
3
3
3
3
3
3
3
3
3
3
3
3
3
3
3
3
3
2
2
2
2
2
2
2
2
2
2
2
2
2
2
2
2
2
2
2
2
2
2
2
2
2
2
2
2
2
2
2
2
2
2
2
2
2
2
2
2
2
2
2
2
2
2
2
2
2
2
2
2
2
2
2
2
2
2
2
2
2
2
2
2
2
2
2
2
2
2
2
2
2
2
2
2
2
2
2
2
2
2
2
2
2
2
2
2
2
2
2
2
2
2
2
2
2
2
2
2
2
2
2
2
2
2
2
2
2
2
2
2
2
2
2
2
2
2
2
2
2
2
2
2
2
2
2
2
2
2
2
2
2
2
2
2
2
2
2
2
2
2
2
2
2
2
2
2
2
2
2
2
2
2
2
2
2
2
2
2
2
2
2
2
2
2
2
2
2
2
2
2
2
2
2
2
2
2
2
2
2
2
2
2
2
2
2
2
2
2
2
2
2
2
2
2
2
2
2
2
2
2
2
2
2
2
2
2
2
2
2
2
2
2
2
2
2
2
2
2
2
2
2
1
1
1
1
1
1
1
1
1
1
1
1
1
1
1
1
1
1
1
1
1
1
1
1
1
1
1
1
1
1
1
1
1
1
1
1
1
1
1
1
1
1
1
1
1
1
1
1
1
1
1
1
1
1
1
1
1
1
1
1
1
1
1
1
1
1
1
1
1
1
1
1
1
1
1
1
1
1
1
1
1
1
1
1
1
1
1
1
1
1
1
1
1
1
1
1
1
1
1
1
1
1
1
1
1
1
1
1
1
1
1
1
1
1
1
1
1
1
1
1
1
1
1
1
1
1
1
1
1
1
1
1
1
1
1
1
1
1
1
1
1
1
1
1
1
1
1
1
1
1
1
1
1
1
1
1
1
1
1
1
1
1
1
1
1
1
1
1
1
1
1
1
1
1
1
1
1
1
1
1
1
1
1
1
1
1
1
1
1
1
1
1
1
1
1
1
1
1
1
1
1
1
1
1
1
1
1
1
1
1
1
1
1
1
1
1
1
1
1
1
1
1
1
1
1
1
1
1
1
1
1
1
1
1
1
1
1
1
1
1
1
1
1
1
1
1
1
1
1
1
1
1
1
1
1
1
1
1
1
1
1
1
1
1
1
1
1
1
1
1
1
1
1
1
1
1
1
1
1
1
1
1
1
1
1
1
1
1
1
1
1
1
1
1
1
1
1
1
1
1
1
1
1
1
1
1
1
1
1
1
1
1
1
1
1
1
1
1
1
1
1
1
1
1
1
1
1
1
1
1
1
1
1
1
1
1
1
1
1
1
1
1
1
1
1
1
1
1
1
1
1
1
1
1
1
1
1
1
1
1
1
1
1
1
1
1
1
1
1
1
1
1
1
1
1
1
1
1
1
1
1
1
1
1
1
1
1
1
1
1
1
1
1
1
1
1
1
1
1
1
1
1
1
1
1
1
1
1
1
1
1
1
1
1
1
1
1
1
1
1
1
1
1
1
1
1
1
1
1
1
1
1
1
1
1
1
1
1
1
1
1
1
1
1
1
1
1
1
1
1
1
1
1
1
1
1
1
1
1
1
1
1
1
1
1
1
1
1
1
1
1
1
1
1
1
1
1
1
1
1
1
1
1
1
1
1
1
1
1
1
1
1
1
1
1
1
1
1
1
1
1
1
1
1
1
1
1
1
1
1
1
1
1
1
1
1
1
1
1
1
1
1
1
1
1
1
1
1
1
1
1
1
1
1
1
1
1
1
1
1
1
1
1
1
1
1
1
1
1
1
1
1
1
1
1
1
1
1
1
1
1
1
1
1
1
1
1
1
1
1
1
1
1
1
1
1
1
1
1
1
1
1
1
1
1
1
1
1
1
1
1
1
1
1
1
1
1
1
1
1
1
1
1
1
1
1
1
1
1
1
1
1
1
1
1
1
1
1
1
1
1
1
1
1
1
1
1
1
1
1
1
1
1
1
1
1
1
1
1
1
1
1
1
1
1
1
1
1
1
1
1
1
1
1
1
1
1
1
1
1
1
1
1
1
1
1
1
1
1
1
1
1
1
1
1
1
1
1
1
1
1
1
1
1
1
1
1
1
1
1
1
1
1
1
1
1
1
1
1
1
1
1
1
1
1
1
1
1
1
1
1
1
1
1
1
1
1
1
1
1
1
1
1
1
1
1
1
1
1
1
1
1
1
1
1
1
1
1
1
1
1
1
1
1
1
1
1
1
1
1
1
1
1
1
1
1
1
1
1
1
1
1
1
1
1
1
1
1
1
1
1
1
1
1
1
1
1
1
1
1
1
1
1
1
1
1
1
1
1
1
1
1
1
1
1
1
1
1
1
1
1
1
1
1
1
1
1
1
1
1
1
1
1
1
1
1
1
1
1
1
1
1
1
1
1
1
1
1
1
1
1
1
1
1
1
1
1
1
1
1
1
1
1
1
1
1
1
1
1
1
1
1
1
1
1
1
1
1
1
1
1
1
1
1
1
1
1
1
1
1
1
1
1
1
1
1
1
1
1
1
1
1
1
1
1
1
1
1
1
1
1
1
1
1
1
1
1
1
1
1
1
1
1
1
1
1
1
1
1
1
1
1
1
1
1
1
1
1
1
1
1
1
1
1
1
1
1
1
1
1
1
1
1
1
1
1
1
1
1
1
1
1
1
1
1
1
1
1
1
1
1
1
1
1
1
1
1
1
1
1
1
1
1
1
1
1
1
1
1
1
1
1
1
1
1
1
1
1
1
1
1
1
1
1
1
1
1
1
1
1
1
1
1
1
1
1
1
1
1
1
1
1
1
1
1
1
1
1
1
1
1
1
1
1
1
1
1
1
1
1
1
1
1
1
1
1
1
1
1
1
1
1
1
1
1
1
1
1
1
1
1
1
1
1
1
1
1
1
1
1
1
1
1
1
1
1
1
1
1
1
1
1
1
1
1
1
1
1
1
1
1
1
1
1
1
1
1
1
1
1
1
1
1
1
1
1
1
1
1
1
1
1
1
1
1
1
1
1
1
1
1
1
1
1
1
1
1
1
1
1
1
1
1
1
1
1
1
1
1
1
1
1
1
1
1
1
1
1
1
1
1
1
1
1
1
1
1
1
1
1
1
1
1
1
1
1
1
1
1
1
1
1
1
1
1
1
1
1
1
1
1
1
1
1
1
1
1
1
1
1
1
1
1
1
1
1
1
1
1
1
1
1
1
1
1
1
1
1
1
1
1
1
1
1
1
1
1
1
1
1
1
1
1
1
1
1
1
1
1
1
1
1
1
1
1
1
1
1
1
1
1
1
1
1
1
1
1
1
1
1
1
1
1
1
1
1
1
1
1
1
1
1
1
1
1
1
1
1
1
1
1
1
1
1
1
1
1
1
1
1
1
1
1
1
1
1
1
1
1
1
1
1
1
1
1
1
1
1
1
1
1
1
1
1
1
1
1
1
1
1
1
1
1
1
1
1
1
1
1
1
1
1
1
1
1
1
1
1
1
1
1
1
1
1
1
1
1
1
1
1
1
1
1
1
1
1
1
1
1
1
1
1
1
1
1
1
1
1
1
1
1
1
1
1
1
1
1
1
1
1
1
1
1
1
1
1
1
1
1
1
1
1
1
1
1
1
1
1
1
1
1
1
1
1
1
1
1
1
1
1
1
1
1
1
1
1
1
1
1
1
1
1
1
1
1
1
1
1
1
1
1
1
1
1
1
1
1
1
1
1
1
1
1
1
1
1
1
1
1
1
1
1
1
1
1
1
1
1
1
1
1
1
1
1
1
1
1
1
1
1
1
1
1
1
1
1
1
1
1
1
1
1
1
1
1
1
1
1
1
1
1
1
1
1
1
1
1
1
1
1
1
1
1
1
1
1
1
1
1
1
1
1
1
1
1
1
1
1
1
1
1
1
1
1
1
1
1
1
1
1
1
1
1
1
1
1
1
1
1
1
1
1
1
1
1
1
1
1
1
1
1
1
1
1
1
1
1
1
1
1
1
1
1
1
1
1
1
1
1
1
1
1
1
1
1
1
1
1
1
1
1
1
1
1
1
1
1
1
1
1
1
1
1
1
1
1
1
1
1
1
1
1
1
1
1
1
1
1
1
1
1
1
1
1
1
1
1
1
1
1
1
1
1
1
1
1
1
1
1
1
1
1
1
1
1
1
1
1
1
1
1
1
1
1
1
1
1
1
1
1
1
1
1
1
1
1
1
1
1
1
1
1
1
1
1
1
1
1
1
1
1
1
1
1
1
1
1
1
1
1
1
1
1
1
1
1
1
1
1
1
1
1
1
1
1
1
1
1
1
1
1
1
1
1
1
1
1
1
1
1
1
1
1
1
1
1
1
1
1
1
1
1
1
1
1
1
1
1
1
1
1
1
1
1
1
1
1
1
1
1
1
1
1
1
1
1
1
1
1
1
1
1
1
1
1
1
1
1
1
1
1
1
1
1
1
1
1
1
1
1
1
1
1
1
1
1
1
1
1
1
1
1
1
1
1
1
1
1
1
1
1
1
1
1
1
1
1
1
1
1
1
1
1
1
1
1
1
1
1
1
1
1
1
1
1
1
1
1
1
1
1
1
1
1
1
1
1
1
1
1
1
1
1
1
1
1
1
1
1
1
1
1
1
1
1
1
1
1
1
1
1
1
1
1
1
1
1
1
1
1
1
1
1
1
1
1
1
1
1
1
1
1
1
1
1
1
1
1
1
1
1
1
1
1
1
1
1
1
1
1
1
1
1
1
1
1
1
1
1
1
1
1
1
1
1
1
1
1
1
1
1
1
1
1
1
1
1
1
1
1
1
1
1
1
1
1
1
1
1
1
1
1
1
1
1
1
1
1
1
1
1
1
1
1
1
1
1
1
1
1
1
1
1
1
1
1
1
1
1
1
1
1
1
1
1
1
1
1
1
1
1
1
1
1
1
1
1
1
1
1
1
1
1
1
1
1
1
1
1
1
1
1
1
1
1
1
1
1
1
1
1
1
1
1
1
1
1
1
1
1
1
1
1
1
1
1
1
1
1
1
1
1
1
1
1
1
1
1
1
1
1
1
1
1
1
1
1
1
1
1
1
1
1
1
1
1
1
1
1
1
1
1
1
1
1
1
1
1
1
1
1
1
1
1
1
1
1
1
1
1
1
1
1
1
1
1
1
1
1
1
1
1
1
1
1
1
1
1
1
1
1
1
1
1
1
1
1
1
1
1
1
1
1
1
1
1
1
1
1
1
1
1
1
1
1
1
1
1
1
1
1
1
1
1
1
1
1
1
1
1
1
1
1
1
1
1
1
1
1
1
1
1
1
1
1
1
1
1
1
1
1
1
1
1
1
1
1
1
1
1
1
1
1
1
1
1
1
1
1
1
1
1
1
1
1
1
1
1
1
1
1
1
1
1
1
1
1
1
1
1
1
1
1
1
1
1
1
1
1
1
1
1
1
1
1
1
1
1
1
1
1
1
1
1
1
1
1
1
1
1
1
1
1
1
1
1
1
1
1
1
1
1
1
1
1
1
1
1
1
1
1
1
1
1
1
1
1
1
1
1
1
1
1
1
1
1
1
1
1
1
1
1
1
1
1
1
1
1
1
1
1
1
1
1
1
1
1
1
1
1
1
1
1
1
1
1
1
1
1
1
1
1
1
1
1
1
1
1
1
1
1
1
1
1
1
1
1
1
1
1
1
1
1
1
1
1
1
1
1
1
1
1
1
1
1
1
1
1
1
1
1
1
1
1
1
1
1
1
1
1
1
1
1
1
1
1
1
1
1
1
1
1
1
1
1
1
1
1
1
1
1
1
1
1
1
1
1
1
1
1
1
1
1
1
1
1
1
1
1
1
1
1
1
1
1
1
1
1
1
1
1
1
1
1
1
1
1
1
1
1
1
1
1
1
1
1
1
1
1
1
1
1
1
1
1
1
1
1
1
1
1
1
1
1
1
1
1
1
1
1
1
1
1
1
1
1
1
1
1
1
1
1
1
1
1
1
1
1
1
1
1
1
1
1
1
1
1
1
1
1
1
1
1
1
1
1
1
1
1
1
1
1
1
1
1
1
1
1
1
1
1
1
1
1
1
1
1
1
1
1
1
1
1
1
1
1
1
1
1
1
1
1
1
1
1
1
1
1
1
1
1
1
1
1
1
1
1
1
1
1
1
1
1
1
1
1
1
1
1
1
1
1
1
1
1
1
1
1
1
1
1
1
1
1
1
1
1
1
1
1
1
1
1
1
1
1
1
1
1
1
1
1
1
1
1
1
1
1
1
1
1
1
1
1
1
1
1
1
1
1
1
1
1
1
1
1
1
1
1
1
1
1
1
1
1
1
1
1
1
1
1
1
1
1
1
1
1
1
1
1
1
1
1
1
1
1
1
1
1
1
1
1
1
1
1
1
1
1
1
1
1
1
1
1
1
1
1
1
1
1
1
1
1
1
1
1
1
1
1
1
1
1
1
1
1
1
1
1
1
1
1
1
1
1
1
1
1
1
1
Publication Years
826
2410
260
7
2
Category
2068
189
174
149
123
27
11
Toolboxes
220
159
126
117
105
74
73
72
69
67
57
52
52
51
45
37
32
27
25
22
15
11
7
6
5
This report presents findings from research conducted by Economist Impact to assess the health, demographic, social and economic impacts associated with different scenarios for financing the HIV epidemic across 13 selected countries in Sub-Saharan A
...
frica. The sponsorship of UNAIDS towards this report is gratefully acknowledged. However, the findings and ideas expressed herein represent those of Economist Impact. They do not necessarily reflect the views and opinions of UNAIDS, nor do they engage the responsibility of UNAIDS.
more

To better adapt current case management practices and address excess mortality in otherwise treatable
cases will require better knowledge of the demographic characteristics of the patients and comorbidities
which can make severe dehydration harder
...
to tolerate physiologically. With this in mind, a scoping review
was undertaken, to explore the literature and summarise the existing evidence on cholera mortality and
reported risk factors.
more
We investigate whether and to what extent Chinese development finance affects infant mortality, combining 92 demographic and health surveys (DHS) for a maximum of 53 countries and almost 55,000 sub-national locations over the 2002-2014 period. We ad
...
dress causality by instrumenting aid with a set of interacted variables. Variation over
time results from indicators that measure the availability of funding in a given year. Cross-sectional variation results from a sub-national region’s “probability to receive aid.” Controlled for this probability in tandem with fixed effects for country-years and provinces, the interactions of these variables form powerful and excludable instruments. Our results show that Chinese aid increases infant mortality at sub-national scales, but decreases mortality at the countrylevel. In several tests, we show that this stark contrast likely results from aid being fungible within recipient countries.
more
Diabetes is an increasingly prevalent yet under-recognised health crisis in Africa, driven by demographic and socioeconomic transitions. In 2021, 24 million adults in the region were living with diabetes, and this figure is expected to increase by 1
...
29% by 2045.
more

Neonatal mortality is a major challenge in reducing child mortality rates in Nepal. Despite efforts by the Government of Nepal, data from the last three demographic and health surveys show a rise in the contribution of neonatal deaths to infant and
...
child mortality. The Government of Nepal has implemented community-based programs that were piloted and then scaled up based on lessons learned. These programs include, but are not limited to ensuring safe motherhood, birth preparedness package, community-based newborn care package, and integrated management of childhood illnesses. Despite the implementation of such programs on a larger scale, their effective coverage is yet to be achieved. Health system challenges included an inadequate policy environment, funding gaps, inadequate procurement, and insufficient supplies of commodities, while human resource management has been found to be impeding service delivery. Such bottlenecks at policy, institutional and service delivery level need to be addressed incorporating health information in decision-making as well as working in partnership with communities to facilitate the utilization of available services.
more
This document presents the findings of the National Census of Persons with Disabilities in Rwanda. The preliminary result of this census has been used to produce a summary analysis of tables and figures. It shall be possible to derive basic socio-demograph
...
ic indicators as well as to obtain the estimate of persons with disability in Rwanda, all of which shall serve as a reference to the categorization activity planned to be done in the near future by a medical committee from the Ministry of Health. The data of this report relate to (1) Persons with disability size for various administrative units (Districts and Provinces), (2) Distribution of Persons with disabilities by sex, age, marital status and type of disabilities.
more
Census Report Volume 4-E
As no census has been undertaken in over 30 years, many aspects of the demographic situation in the country were unknown. For instance, before the Census it was thought that the country had a population of about 60 mill ... ion, but the 2014 Census showed that the population (including an estimate for under-enumeration) was 51,486,253 persons, around 8.5 million less than the previous estimate.
In the 1983 census, 35,307,913 persons were recorded. Therefore between 1983 and 2014, the population increased by 46 per cent. With an average annual population growth rate of 0.89 per cent between 2003 and 2014, Myanmar is one of the slowest growing countries in Southeast Asia. more

Access to Services and Barriers faced by People with Disabilities: A Quantitative Survey
Nathan Grills, Lawrence Singh, Hira Pant, Jubin Varghese, GVS Murthy, Monsurul Hoq, Manjula Marella
Disability, CBR & Inclusive Development Journal (DCIDJ)
(2017)
CC
In low- and middle-income middle-income countries, reliable and disaggregated disability data on prevalence, participation and barriers are often unavailable. This study aimed to estimate disability prevalence, determine associated socio-demographic
...
factors and compare access in the community between people with and without disability in Dehradun district of Uttarakhand, India, using the Rapid Assessment of Disability survey.
more
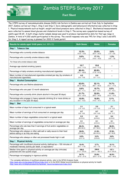
The STEPS survey of noncommunicable disease (NCD) risk factors in Zambia was carried out from July to September 2017. Zambia carried out Step 1, Step 2 and Step 3. Socio demographic and behavioural information was collected in Step 1. Physical measu
...
rements such as height, weight and blood pressure were collected in Step 2. Biochemical measurements were collected to assess blood glucose and cholesterol levels in Step 3. The survey was a population-based survey of adults aged 18-69. A multi-stage cluster sample design was used to produce representative data for that age range in Zambia. A total of 4,302 adults participated in the survey. The overall response rate was 74% for Step 1 and 2 and 65% for Step 3. A repeat survey is planned for 2022 if funds permit.
more
Accessed on 31.01.2020
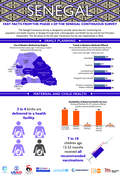
The Senegal Continuous Survey is designed to provide yearly data for monitoring the population and health situation in Senegal through both a Demographic and Health Survey and Service Provision Assessment. The 4th phase of
...
the five-year Continuous Survey was implemented in 2016.
more

Massoda Tonye et al. Malar J (2018) 17:156
https://doi.org/10.1186/s12936-018-2284-7
Background: In 2011, the demographic and health survey (DHS) in Cameroon was combined with the multiple indicator
cluster survey. Malaria parasitological data
...
were collected, but the survey period did not overlap with the high
malaria transmission season. A malaria indicator survey (MIS) was also conducted during the same year, within the
malaria peak transmission season. This study compares estimates of the geographical distribution of malaria parasite
risk and of the effects of interventions obtained from the DHS and MIS survey data.
more
It is estimated that more than 311 000 women die of cervical
cancer each year. Of these deaths, 91% occur in low- and
middle-income countries. Demographic changes and a lack of
action mean that the number of deaths per year is projected
to reach
...
460 000 by 2040.
more
The prevalence of chronic non-communicable diseases such as diabetes, cardiovascular diseases and cancers has been on the increase in Kenya in the recent past. This has been occasioned by changes in social and demographic
...
situation in the country. The life expectancy in the country is improving, while the country is developing at a rapid pace. This has resulted in people living more years and at the time adopting lifestyles that have negative impacts on their health. This increase in diabetes and other non-communicable diseases has given rise to a double burden of communicable and non-communicable diseases in Kenya
more
Heart failure (HF) is a global public health concern with disproportionate socioeconomic, morbidity and mortality burden on low- and middle-income countries (LMICs). This review summarises contemporary data on the demographic and clinical characteri
...
stics, aetiologies, treatment, economic burden and outcomes of HF in LMICs. Patients with HF in LMICs are younger than those from high-income countries (HICs) and present at advanced stages of the disease. Hypertension, ischaemic heart disease (IHD), cardiomyopathy (CMO), and rheumatic heart disease (RHD) are the leading causes of HF in LMICs. The contribution of infectious diseases to HF remains prominent in many LMICs. Most health facilities in LMICs lack adequate diagnostic tools for HF, and the use of evidence-based medical and device therapies is suboptimal. Further, HF in LMICs is associated with prolonged hospital stay and high in-hospital and one-year mortality. Finally, HF has profound economic impact on individual patients who, mostly, have no health insurance, and on societies where patients are young, comprising those who have the greatest potential to contribute to economic productivity.
more

An estimated 1.3 billion people globally experience significant disability. This figure has grown over the last decade and will continue to rise due to demographic and epidemiological changes. In 2022, the World Health Organization launched the Glob
...
al report on health equity for persons with disabilities. This report demonstrated that many persons with disabilities are still being left behind. Experiencing persistent health inequities, persons with disabilities die earlier, they have poorer health and functioning, and they are more affected by health emergencies than the general population. These differences are largely associated with unjust factors both inside and beyond the health sector and are avoidable. The Global Report called upon Member States to take actions to make health sector more inclusive for persons with disabilities through the primary health care approach. This will be essential for countries to make health coverage truly universal and to progress towards other health-related targets in the sustainable development goals.
more
The Atlas of health and climate is a product of this unique collaboration between the meteorological and public health communities. It provides sound scientific information on the connections between weather and climate and major health challenges. These range from diseases of poverty to emergencies
...
arising from extreme weather events and disease outbreaks. They also include environmental degradation, the increasing prevalence of noncommunicable diseases and the universal trend of demographic ageing.
more
This report investigates the impact of potential misclassification of samples on HIV prevalence estimates for 23 surveys conducted from 2010-2014. In addition to visual inspection of laboratory results, we examined how accounting for potential misclassification of HIV status through Bayesian latent
...
class models affected the prevalence estimates. Two types of Bayesian models were specified: a model that only uses the individual dichotomous test results and a continuous model that uses the quantitative information of the EIA (i.e., the signal-to-cutoff values). Overall, we found that adjusted prevalence estimates matched the surveys’ original results, with overlapping uncertainty intervals. This suggested that misclassification of HIV status should not affect the prevalence estimates in most surveys. However, our analyses suggested that two surveys may be problematic. The prevalence could have been overestimated in the Uganda AIDS Indicator Survey 2011 and the Zambia Demographic and Health Survey 2013-14, although the magnitude of overestimation remains difficult to ascertain. Interpreting results from the Uganda survey is difficult because of the lack of internal quality control and potential violation of the multivariate normality assumption of the continuous Bayesian latent class model. In conclusion, despite the limitations of our latent class models, our analyses suggest that prevalence estimates from most of the surveys reviewed are not affected by sample misclassification.
more
Levels and Inequities
DHS Further Analysis Reports No. 110
This study shows large variations in maternal health indicators across high-priority counties in Kenya. Nairobi exceeds the national average on all maternal health indicators in this study, while other highpriority counties consist ... ently are disadvantaged compared with Kenya as a whole in most maternal health indicators. Kisumu exceeds the national average in use of antenatal care, delivery in a health facility, and postnatal care, but not other indicators. Nakuru has fewer women with fertility risk and fewer women who report that the distance they must travel to reach a health facility is a problem.
This study identifies a number of inequities in maternal health indicators across socio-demographic characteristics in the high-priority counties—most in the distribution of delivery care and least in antenatal care. Inequities are also observed in fertility risk and postnatal care. more
Impact of health systems strengthening on coverage of maternal health services in Rwanda, 2000–2010: a systematic review
Maurice Bucagu, Jean M. Kagubare, Paulin Basinga, Fidèle Ngabo, Barbara K Timmons & Angela C Lee
Reproductive Health Matters
(2012)
CC
From 2000 to 2010, Rwanda implemented comprehensive health sector reforms to strengthen the public health system, with the aim of reducing maternal and newborn deaths in line with Millennium Development Goal 5, among many other improvements in national health. Based on a systematic review of the lit
...
erature, national policy documents and three Demographic & Health Surveys (2000, 2005 and 2010), this paper describes the reforms and the policies they were based on, and provides data on the extent of Rwanda’s progress in expanding the coverage of four key women’s health services. Progress took place in 2000–2005 and became more rapid after 2006, mostly in rural areas, when the national facility-based childbirth policy, performance-based financing, and community-based health insurance were scaled up. Between 2006 and 2010, the following increases in coverage took place as compared to 2000–2005, particularly in rural areas, where most poor women live: births with skilled attendance (77% increase vs. 26%), institutional delivery (146% increase vs. 8%), and contraceptive prevalence (351% increase vs. 150%). The primary factors in these improvements were increases in the health workforce and their skills, performance-based financing, community-based health insurance, and better leadership and governance. Further research is needed to determine the impact of these changes on health outcomes in women and children.
more
Annual Household Survey 2015/16 is the forth survey of its kind. These annual surveys are conducted to provide estimations of some major socio-economic indicators on annual basis which would not be possible with other periodic surveys like Nepal Labour Force Surveys (NLSS) and Nepal Living Standard
...
Surveys (NLSS) which are undertaken at longer intervals. The survey basically aims to provide estimates of consumption by sex, urban-rural area and by consumption quintiles/deciles. Although the major thrust of Annual Household Survey is on consumption and employment situations, other sectors like education, housing and housing facilities and demographic characteristics are also included. As this year NLSS survey is conducted so, this survey does not contain information on employment situation as in previous annual household surveys.
more