Filter
4332
Text search:
service
indicators
Featured
362
1377
Language
4199
127
80
51
47
33
22
9
8
6
5
4
3
3
3
2
2
2
2
2
2
2
2
1
1
1
1
1
1
1
1
1
1
1
1
1
1
1
1
1
1
1
1
1
1
1
1
1
Document type
2476
755
475
245
244
56
37
26
9
4
3
1
1
Countries
200
191
165
141
130
117
100
93
90
85
84
84
84
80
78
77
73
72
71
63
49
45
44
42
38
38
37
35
32
32
29
29
28
25
24
24
20
19
18
18
16
16
16
16
14
14
13
13
12
11
11
11
10
9
9
9
8
8
8
8
8
7
7
7
6
6
6
6
6
5
5
5
5
5
5
5
5
5
4
4
4
4
4
4
3
3
3
3
3
3
3
3
2
2
2
2
2
2
2
2
2
2
2
2
2
2
2
2
2
2
2
1
1
1
1
1
1
1
1
1
1
1
1
1
1
1
1
1
1
1
1
1
1
1
1
1
1
1
1
1
1
Authors & Publishers
535
150
120
115
98
97
87
52
49
33
33
29
28
26
23
23
23
20
19
19
18
18
18
17
17
17
17
17
16
16
16
16
15
15
15
14
14
14
14
13
13
12
12
12
12
11
11
11
11
11
11
10
10
10
10
10
10
10
10
10
9
9
9
9
9
9
9
9
9
9
8
8
8
8
8
8
7
7
7
7
7
7
7
7
7
7
7
7
7
6
6
6
6
6
6
6
6
6
6
6
6
6
6
6
6
6
6
6
6
6
6
6
6
6
6
6
6
6
6
6
5
5
5
5
5
5
5
5
5
5
5
5
5
5
5
5
5
4
4
4
4
4
4
4
4
4
4
4
4
4
4
4
4
4
4
4
4
4
4
4
4
4
4
4
4
4
4
4
4
4
4
4
4
4
4
4
4
4
4
4
4
4
4
4
4
4
4
4
4
4
3
3
3
3
3
3
3
3
3
3
3
3
3
3
3
3
3
3
3
3
3
3
3
3
3
3
3
3
3
3
3
3
3
3
3
3
3
3
3
3
3
3
3
3
3
3
3
3
3
3
3
3
3
3
3
3
3
3
3
3
3
3
3
3
3
3
3
3
3
3
3
3
3
3
3
3
3
3
3
3
3
3
3
3
3
3
3
3
3
2
2
2
2
2
2
2
2
2
2
2
2
2
2
2
2
2
2
2
2
2
2
2
2
2
2
2
2
2
2
2
2
2
2
2
2
2
2
2
2
2
2
2
2
2
2
2
2
2
2
2
2
2
2
2
2
2
2
2
2
2
2
2
2
2
2
2
2
2
2
2
2
2
2
2
2
2
2
2
2
2
2
2
2
2
2
2
2
2
2
2
2
2
2
2
2
2
2
2
2
2
2
2
2
2
2
2
2
2
2
2
2
2
2
2
2
2
2
2
2
2
2
2
2
2
2
2
2
2
2
2
2
2
2
2
2
2
2
2
2
2
2
2
2
2
2
2
2
2
2
2
2
2
2
2
2
2
2
2
2
2
2
2
2
2
2
2
2
2
2
2
2
2
2
2
2
2
2
2
2
2
2
2
2
2
2
2
2
2
2
2
2
2
2
2
2
2
2
2
2
2
2
2
2
2
2
2
2
2
2
2
2
2
2
2
2
2
2
2
2
2
2
2
2
2
2
2
2
2
2
2
2
2
2
2
2
1
1
1
1
1
1
1
1
1
1
1
1
1
1
1
1
1
1
1
1
1
1
1
1
1
1
1
1
1
1
1
1
1
1
1
1
1
1
1
1
1
1
1
1
1
1
1
1
1
1
1
1
1
1
1
1
1
1
1
1
1
1
1
1
1
1
1
1
1
1
1
1
1
1
1
1
1
1
1
1
1
1
1
1
1
1
1
1
1
1
1
1
1
1
1
1
1
1
1
1
1
1
1
1
1
1
1
1
1
1
1
1
1
1
1
1
1
1
1
1
1
1
1
1
1
1
1
1
1
1
1
1
1
1
1
1
1
1
1
1
1
1
1
1
1
1
1
1
1
1
1
1
1
1
1
1
1
1
1
1
1
1
1
1
1
1
1
1
1
1
1
1
1
1
1
1
1
1
1
1
1
1
1
1
1
1
1
1
1
1
1
1
1
1
1
1
1
1
1
1
1
1
1
1
1
1
1
1
1
1
1
1
1
1
1
1
1
1
1
1
1
1
1
1
1
1
1
1
1
1
1
1
1
1
1
1
1
1
1
1
1
1
1
1
1
1
1
1
1
1
1
1
1
1
1
1
1
1
1
1
1
1
1
1
1
1
1
1
1
1
1
1
1
1
1
1
1
1
1
1
1
1
1
1
1
1
1
1
1
1
1
1
1
1
1
1
1
1
1
1
1
1
1
1
1
1
1
1
1
1
1
1
1
1
1
1
1
1
1
1
1
1
1
1
1
1
1
1
1
1
1
1
1
1
1
1
1
1
1
1
1
1
1
1
1
1
1
1
1
1
1
1
1
1
1
1
1
1
1
1
1
1
1
1
1
1
1
1
1
1
1
1
1
1
1
1
1
1
1
1
1
1
1
1
1
1
1
1
1
1
1
1
1
1
1
1
1
1
1
1
1
1
1
1
1
1
1
1
1
1
1
1
1
1
1
1
1
1
1
1
1
1
1
1
1
1
1
1
1
1
1
1
1
1
1
1
1
1
1
1
1
1
1
1
1
1
1
1
1
1
1
1
1
1
1
1
1
1
1
1
1
1
1
1
1
1
1
1
1
1
1
1
1
1
1
1
1
1
1
1
1
1
1
1
1
1
1
1
1
1
1
1
1
1
1
1
1
1
1
1
1
1
1
1
1
1
1
1
1
1
1
1
1
1
1
1
1
1
1
1
1
1
1
1
1
1
1
1
1
1
1
1
1
1
1
1
1
1
1
1
1
1
1
1
1
1
1
1
1
1
1
1
1
1
1
1
1
1
1
1
1
1
1
1
1
1
1
1
1
1
1
1
1
1
1
1
1
1
1
1
1
1
1
1
1
1
1
1
1
1
1
1
1
1
1
1
1
1
1
1
1
1
1
1
1
1
1
1
1
1
1
1
1
1
1
1
1
1
1
1
1
1
1
1
1
1
1
1
1
1
1
1
1
1
1
1
1
1
1
1
1
1
1
1
1
1
1
1
1
1
1
1
1
1
1
1
1
1
1
1
1
1
1
1
1
1
1
1
1
1
1
1
1
1
1
1
1
1
1
1
1
1
1
1
1
1
1
1
1
1
1
1
1
1
1
1
1
1
1
1
1
1
1
1
1
1
1
1
1
1
1
1
1
1
1
1
1
1
1
1
1
1
1
1
1
1
1
1
1
1
1
1
1
1
1
1
1
1
1
1
1
1
1
1
1
1
1
1
1
1
1
1
1
1
1
1
1
1
1
1
1
1
1
1
1
1
1
1
1
1
1
1
1
1
1
1
1
1
1
1
1
1
1
1
1
1
1
1
1
1
1
1
1
1
1
1
1
1
1
1
1
1
1
1
1
1
1
1
1
1
1
1
1
1
1
1
1
1
1
1
1
1
1
1
1
1
1
1
1
1
1
1
1
1
1
1
1
1
1
1
1
1
1
1
1
1
1
1
1
1
1
1
1
1
1
1
1
1
1
1
1
1
1
1
1
1
1
1
1
1
1
1
1
1
1
1
1
1
1
1
1
1
1
1
1
1
1
1
1
1
1
1
1
1
1
1
1
1
1
1
1
1
1
1
1
1
1
1
1
1
1
1
1
1
1
1
1
1
1
1
1
1
1
1
1
1
1
1
1
1
1
1
1
1
1
1
1
1
1
1
1
1
1
1
1
1
1
1
1
1
1
1
1
1
1
1
1
1
1
1
1
1
1
1
1
1
1
1
1
1
1
1
1
1
1
1
1
1
1
1
1
1
1
1
1
1
1
1
1
1
1
1
1
1
1
1
1
1
1
1
1
1
1
1
1
1
1
1
1
1
1
1
1
1
1
1
1
1
1
1
1
1
1
1
1
1
1
1
1
1
1
1
1
1
1
1
1
1
1
1
1
1
1
1
1
1
1
1
1
1
1
1
1
1
1
1
1
1
1
1
1
1
1
1
1
1
1
1
1
1
1
1
1
1
1
1
1
1
1
1
1
1
1
1
1
1
1
1
1
1
1
1
1
1
1
1
1
1
1
1
1
1
1
1
1
1
1
1
1
1
1
1
1
1
1
1
1
1
1
1
1
1
1
1
1
1
1
1
1
1
1
1
1
1
1
1
1
1
1
1
1
1
1
1
1
1
1
1
1
1
1
1
1
1
1
1
1
1
1
1
1
1
1
1
1
1
1
1
1
1
1
1
1
1
1
1
1
1
1
1
1
1
1
1
1
1
1
1
1
1
1
1
1
1
1
1
1
1
1
1
1
1
1
1
1
1
1
1
1
1
1
1
1
1
1
1
1
1
1
1
1
1
1
1
1
1
1
1
1
1
1
1
1
1
1
1
1
1
1
1
1
1
1
1
1
1
1
1
1
1
1
1
1
1
1
1
1
1
1
1
1
1
1
1
1
1
1
1
1
1
1
1
1
1
1
1
1
1
1
1
1
1
1
1
1
1
1
1
1
1
1
1
1
1
1
1
1
1
1
1
1
1
1
1
1
1
1
1
1
1
1
1
1
1
1
1
1
1
1
1
1
1
1
1
1
1
1
1
1
1
1
1
1
1
1
1
1
1
1
1
1
1
1
1
1
1
1
1
1
1
1
1
1
1
1
1
1
1
1
1
1
1
1
1
1
1
1
1
1
1
1
1
1
1
1
1
1
1
1
1
1
1
1
1
1
1
1
1
1
1
1
1
1
1
1
1
1
1
1
1
1
1
1
1
1
1
1
1
1
1
1
1
1
1
1
1
1
1
1
1
1
1
1
1
1
1
1
1
1
1
1
1
1
1
1
1
1
1
1
1
1
1
1
1
1
1
1
1
1
1
1
1
1
1
1
1
1
1
1
1
1
1
1
1
1
1
1
1
1
1
1
1
1
1
1
1
1
1
1
1
1
1
1
1
1
1
1
1
1
1
1
1
1
1
1
1
1
1
1
1
1
1
1
1
1
1
1
1
1
1
1
1
1
1
1
1
1
1
1
1
1
1
1
1
1
1
1
1
1
1
1
1
1
1
1
1
1
1
1
1
1
1
1
1
1
1
1
1
1
1
1
1
1
1
1
1
1
1
1
1
1
1
1
1
1
1
1
1
1
1
1
1
1
1
1
1
1
1
1
1
1
1
1
1
1
1
1
1
1
1
1
1
1
1
1
1
1
1
1
1
1
1
1
1
1
1
1
1
1
1
1
1
1
1
1
1
1
1
1
1
1
1
1
1
1
1
1
1
1
1
1
1
1
1
1
1
1
1
1
1
1
1
1
1
1
1
1
1
1
1
1
1
1
1
1
1
1
1
1
1
1
1
1
1
1
1
1
1
1
1
1
1
1
1
1
1
1
1
1
1
1
1
1
1
1
1
1
1
1
1
1
1
1
1
1
1
1
1
1
1
1
1
1
1
1
1
1
1
1
1
1
1
1
1
1
1
1
1
1
1
1
1
1
1
1
1
1
1
1
1
1
1
1
1
1
1
1
1
1
1
1
1
1
1
1
1
1
1
1
1
1
1
1
1
1
1
1
1
1
1
1
1
1
1
1
1
1
1
1
1
1
1
1
1
1
1
1
1
1
1
1
1
1
1
1
1
1
1
1
1
1
1
1
1
1
1
1
1
1
1
1
1
1
1
1
1
1
1
1
1
1
1
1
1
1
1
1
1
1
1
1
1
1
1
1
1
1
1
1
1
1
1
1
1
1
1
1
1
1
1
1
1
1
1
1
1
1
1
1
1
1
1
1
1
1
1
1
1
1
1
1
1
1
1
1
1
1
1
1
1
1
1
1
1
1
1
1
1
1
1
1
1
1
1
1
1
1
1
1
1
1
1
1
1
1
1
1
1
1
1
1
1
1
1
1
1
1
1
1
1
1
1
1
1
1
1
1
1
1
1
1
1
1
1
1
1
1
1
1
1
1
1
1
1
1
1
1
1
1
1
1
1
1
1
1
1
1
1
1
1
1
1
1
1
1
1
1
1
1
1
1
1
1
1
1
1
1
1
1
1
1
1
1
1
1
1
1
1
1
1
1
1
1
1
1
1
1
1
1
1
1
1
1
1
1
1
1
1
1
1
1
1
1
1
1
1
1
1
1
1
1
1
1
1
1
1
1
1
1
1
1
1
1
1
1
1
1
1
1
1
1
1
1
1
1
1
1
1
1
1
1
1
1
1
1
1
1
1
1
1
1
1
1
1
1
1
1
1
1
1
1
1
1
1
1
1
1
1
1
1
1
1
1
1
1
1
1
1
1
1
1
1
1
1
1
1
1
1
1
1
1
1
1
1
1
1
1
1
1
1
1
1
1
1
1
1
1
1
1
1
1
1
1
1
1
1
1
1
1
1
1
1
1
1
1
1
1
1
1
1
1
1
1
1
1
1
1
1
1
1
1
1
1
1
1
1
1
1
1
1
1
1
1
1
1
1
1
1
1
1
1
1
1
1
1
1
1
1
1
1
1
1
1
1
1
1
1
1
1
1
1
1
1
1
1
1
1
1
1
1
1
1
1
1
1
1
1
1
1
1
1
1
1
1
1
1
1
1
1
1
1
1
1
1
1
1
1
1
1
1
1
1
1
1
1
1
1
1
1
1
1
1
1
1
1
1
1
1
1
1
1
1
1
1
1
1
1
1
1
1
1
1
1
1
1
1
1
1
1
1
1
1
1
1
1
1
1
1
1
1
1
1
1
1
1
1
1
1
1
1
1
1
1
1
1
1
1
1
1
1
1
1
1
1
1
1
1
1
1
1
1
1
1
1
1
1
1
1
1
1
1
1
1
1
1
1
1
1
1
1
1
1
1
1
1
1
1
1
1
1
1
1
1
1
1
1
1
1
1
1
1
1
1
1
1
1
1
1
1
1
1
1
1
1
1
1
1
1
1
1
1
1
1
1
1
1
1
1
1
1
1
1
1
1
1
1
1
1
1
1
1
1
1
1
1
1
1
1
1
1
1
1
1
1
1
1
1
1
1
1
1
1
1
1
1
1
1
1
1
1
1
1
1
1
1
1
1
1
1
1
1
1
1
1
1
1
1
1
1
1
1
1
1
1
1
1
1
1
1
1
1
1
1
1
1
1
1
1
1
1
1
1
1
1
1
1
1
1
1
1
1
1
1
1
1
1
1
1
1
1
1
1
1
1
1
1
1
1
1
1
1
1
1
1
1
1
1
1
1
1
1
1
1
1
1
1
1
1
1
1
1
1
1
1
1
1
1
1
1
1
1
1
1
1
1
1
1
1
1
1
1
1
1
1
1
1
1
1
1
1
1
1
1
1
1
1
1
1
1
1
1
1
1
1
1
1
1
1
1
1
1
1
1
1
1
1
1
1
1
1
1
1
1
1
1
1
1
1
1
1
1
1
1
1
1
1
1
1
1
1
1
1
1
1
1
1
1
1
1
1
1
1
1
1
1
1
1
1
1
1
1
1
1
1
1
1
1
1
1
1
1
1
1
1
1
1
1
1
1
1
1
1
1
1
1
1
1
1
1
1
1
1
1
1
1
1
1
1
1
1
1
1
1
1
1
1
1
1
1
1
1
1
1
1
1
1
1
1
1
1
1
1
1
1
1
1
1
1
1
1
1
1
1
1
1
1
1
1
1
1
1
1
1
1
1
1
1
1
1
1
1
1
1
1
1
1
1
1
1
1
1
1
1
1
1
Publication Years
1197
2753
368
13
1
Category
2080
349
257
228
223
75
26
Toolboxes
274
233
202
181
152
136
131
128
107
96
84
83
74
66
65
62
54
50
47
46
24
22
13
11
8
2
1
For the 24th consecutive year, PAHO has published the report Health Situation in the Americas: Core Indicators featuring the latest information on key indicators for the Region of the Americas. This
...
2018 edition includes data on the 82 core indicators for the countries, territories, and sub regions of the Americas, grouped into the following categories: demographic-socioeconomic, health status, risk factors, service coverage, and health systems. Information is also presented on 22 indicators of the Sustainable Development Goals (SDGs).
more
Barriers to the prompt and effective diagnosis and treatment of malaria exist at both the community and health facility level. Household surveys measure malaria case management at the population level with standard indicators that assess treatment-s
...
eeking behavior, access to diagnostic testing, and access to appropriate treatment. Performance on these indicators varies widely from country to country. Among countries with Demographic and Health Surveys (DHS) or Malaria Indicator Surveys (MIS) completed between 2014 and 2016, advice and treatment was sought for a median of 47% of children under age 5 with fever.
more
The Guidance on global monitoring for diabetes prevention and control by WHO provides a comprehensive framework to support countries in tracking and managing diabetes prevention, care, and outcomes. This document outlines indicators across 4 domains
...
: health system determinants, service delivery, risk factors, and outcomes/impacts. The guidance helps countries align their monitoring efforts with WHO’s global diabetes targets, Global Diabetes Compact, and relevant global NCD targets.
more

Version-1, June 2018
This document provides 3MDG stakeholders with essential information on SRHR indicators, derived from the 3MDG Logical Framework, Data Dictionary for Health Service ... Indicators (2014 June, DoPH, MoHA), A Guide to Monitoring and Evaluating Adolescent Reproductive Health Programs (MEASURE Evaluation, June 2000) and Monitoring National Cervical Cancer Prevention and Control Programmes (WHO, PAHO, 2013). Partners are strongly encouraged to integrate the SRHR indicators into their ongoing monitoring and evaluation (M&E) activities.
These indicators are designed to help partners assess the current state of their activities, their progress towards achieving their targets, and contribution towards the national response. This guideline is designed to improve the quality and consistency of data collected at the township level, which will enhance the accuracy of conclusions drawn when the data are aggregated. more
A stated objective of WHO’s European Mental Health Action Plan 2013–2020 is to ensure better information and knowledge for service planning, development, monitoring and evaluation, including requesting Member States to report on the
...
indicators in the Plan.
Progress towards achieving the internationally agreed mental health objectives and targets is monitored in the periodic WHO Mental Health Atlas, which collates global information on mental health policies, resources and services.
This booklet provides a snapshot of the situation in countries in the WHO European region with regard to a number of core mental health targets and indicators, derived from the WHO’s Mental Health Atlas 2017.
more

Version 2, January 2016
The primary purpose of this document is to provide 3MDG stakeholders with some essential information on the MNCH core-indicators for 3MDG, which were derived from the 3MDG Logical Framework, Data Dictionary for Health ... Service Indicators (2014 June, DoPH, MoH), A Guide for Monitoring and Evaluating Child Health Programmes (MEASURE Evaluation, September 2005) and Monitoring Emergency Obstetric Care (WHO/UNICEF/UNFPA/AMDD). Partners are strongly encouraged to integrate the MNCH indicators into their ongoing monitoring and evaluation (M&E) activities.
These indicators are designed to help Partners assess the current state of their activities, their progress towards achieving their targets, and contribution towards the national response. This guideline is designed to improve the quality and consistency of data collected at the township level, which will enhance the accuracy of conclusions drawn when the data are aggregated. more
INTRODUCTION: The COVID-19 pandemic has disrupted health systems around the world. The objectives of this study are to estimate the overall effect of the pandemic on essential health service use and outcomes in Mexico, describe observed and predicte
...
d trends in services over 24 months, and to estimate the number of visits lost through December 2020.
METHODS: We used health information system data for January 2019 to December 2020 from the Mexican Institute of Social Security (IMSS), which provides health services for more than half of Mexico's population-65 million people. Our analysis includes nine indicators of service use and three outcome indicators for reproductive, maternal and child health and non-communicable disease services. We used an interrupted time series design and linear generalised estimating equation models to estimate the change in service use and outcomes from April to December 2020. Estimates were expressed using average marginal effects on the risk ratio scale.
RESULTS: The study found that across nine health services, an estimated 8.74 million patient visits were lost in Mexico. This included a decline of over two thirds for breast and cervical cancer screenings (79% and 68%, respectively), over half for sick child visits and female contraceptive services, approximately one-third for childhood vaccinations, diabetes, hypertension and antenatal care consultations, and a decline of 10% for deliveries performed at IMSS. In terms of patient outcomes, the proportion of patients with diabetes and hypertension with controlled conditions declined by 22% and 17%, respectively. Caesarean section rate did not change.
CONCLUSION: Significant disruptions in health services show that the pandemic has strained the resilience of the Mexican health system and calls for urgent efforts to resume essential services and plan for catching up on missed preventive care even as the COVID-19 crisis continues in Mexico.
more
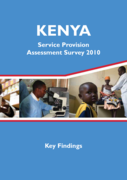
This report presents further analysis of the 2015 Nepal Health Facility Survey. Data analysis is based on the Donabedian framework for assessing quality of care in health services, which divides the indicators into three groups: structure, process,
...
and outcome. The World Health Organization Service Availability and Readiness Assessment (SARA) indicator guideline was used to assess facility service readiness, service quality and client satisfaction with maternal health services. The study performed both bivariate and multivariate regression analysis to examine the association of maternal health service readiness and quality indicators with client satisfaction.
more

The African Palliative Care Association is pleased to publish the first edition of Palliative Care Standards for Africa. The development of these standards was achieved through wide consultation with service beneficiaries and providers, and the
...
y have been developed to suit different levels of service delivery, from primary to tertiary. These standards are underpinned by the World Health Organization’s definition of palliative care, and recognise that scaling up palliative care requires a public health approach with four pillars: policy, education, drug availability and implementation. In addition, the increasing need to establish specific indicators of quality and effectiveness for palliative care has been a big driving force behind these comprehensive standards. It is APCA’s wish that they will provide a framework for the development of evaluation
and performance indicators that can facilitate programme improvement and development. The standards are designed to allow the development or improvement of palliative care across the different services levels, within the organisational capacity of various service providers. They describe a relationship between primary, intermediary and tertiary level service providers, with expectations for all providers articulated through detailed criteria for each standard. It is therefore expected that these standards will influence the planning and delivery of palliative care services at all levels of health care service delivery.
more
The World Health Organization and the Global Fund to Fight AIDS, Tuberculosis and Malaria are part of a group of agencies working together to accelerate progress towards the health-related SDGs through the Global Action Plan for Healthy Lives and Well-being for All. Understanding patterns of inequal
...
ities in these diseases is essential for taking strategic, evidence-informed action to realize our shared vision of ending the epidemics of HIV, TB and malaria.
This report presents the first comprehensive analysis of the magnitude and patterns of socioeconomic, demographic and geographic inequalities in disease burden and access to services for prevention and treatment.
The results confirm there have been improvements in service coverage and decreased disease burden at the national level over the past decade. But they also reveal an uncomfortable reality: unfair inequalities between population subgroups within countries are widespread and have remained largely unchanged over the past decade. For some disease indicators, inequalities are even worsening.
Moreover, the report points to the persistent lack of available data to fully understand inequality patterns in HIV, TB and malaria. Collecting data to improve the monitoring of inequalities in these diseases is vital to develop targeted responses for impact.
There are, encouragingly, isolated successes in reducing inequities. Change is possible when deliberate action is taken to reach disadvantaged populations.
more

Background: Cervical cancer accounts for 23% of cancer incidence and 22% of cancer mortality among women in Burkina Faso. These proportions are more than 2 and 5 times higher than those of developed countries, respectively. Before 2010, cervical cancer prevention (CECAP) services in Burkina Faso wer
...
e limited to temporary screening campaigns.
Program Description: Between September 2010 and August 2014, program implementers collaborated with the Ministry of Health and professional associations to implement a CECAP program focused on coupling visual inspection with acetic acid (VIA) for screening with same-day cryotherapy treatment for eligible women in 14 facilities. Women with larger lesions or lesions suspect for cancer were referred for loop electrosurgical excision procedure (LEEP). The program trained providers, raised awareness through demand generation activities, and strengthened monitoring capacity.
Methods: Data on program activities, service provision, and programmatic lessons were analyzed. Three data collection tools, an individual client form, a client registry, and a monthly summary sheet, were used to track 3 key CECAP service indicators: number of women screened using VIA, proportion of women who screened VIA positive, and proportion of women screening VIA positive who received same-day cryotherapy.
Results: Over 4 years, the program screened 13,999 women for cervical cancer using VIA; 8.9% screened positive; and 65.9% received cryotherapy in a single visit. The proportion receiving cryotherapy on the same day started at a high of 82% to 93% when services were provided free of charge, but dropped to 51% when a user fee of $10 was applied to cover the cost of supplies. After reducing the fee to $4 in November 2012, the proportion increased again to 78%. Implementation challenges included difficulties tracking referred patients, stock-outs of key supplies, difficulties with machine maintenance, and prohibitive user fees. Providers were trained to independently monitor services, identify gaps, and take corrective actions.
Conclusions: Following dissemination of the results that demonstrated the acceptability and feasibility of the CECAP program, the Burkina Faso Ministry of Health included CECAP services in its minimum service delivery package in 2016. Essential components for such programs include provider training on VIA, cryotherapy, and LEEP; provider and patient demand generation; local equipment maintenance; consistent supply stocks; referral system for LEEP; non-prohibitive fees; and a monitoring data collection system.
more
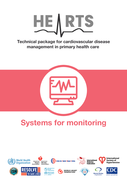
Monitoring is a crucial element in any successful programme. It is important to
know if health care facilities – and ultimately countries – are meeting the agreed
goals and objectives for preventing and managing cardiovascular diseases (CVD).
Monitoring is the on-going collection, management
...
and use of information to
assess whether an activity or programme is proceeding according to plan and/
or achieving defined targets. Not all outcomes of interest can be monitored. Clear
outcomes must be identified that relate to the most important changes expected to result from the project and to what is realistic and measurable within the timescale of the project. Once these outcomes have been articulated, indicators can be chosen that best measure whether the desired outcomes are being met.
To allow progress to be monitored, this module provides a set of indicators on
CVD management. Agreeing on a set of indicators allows countries to compare
progress in CVD management and treatment across different districts or
subnational jurisdictions, as well as at a facility level, identify where performance
can be improved, and track trends in implementation over time. Monitoring
these indicators also helps identify problems that may be encountered so that
implementation efforts can be redirected.
This module starts from the collection of data at facility level, which is then
“transferred up” the system: facility-level data are aggregated at subnational level
to produce reports that allow tracking of facility and subnational performance over time and allow for comparison among facilities. National-level data are obtained through population-based surveys.
Implementing a monitoring system requires action at many levels. At national and
subnational levels, staff can determine how best to integrate data elements into
existing data collection systems – such as the routine service-delivery data that are collected through facility-level Health Management Information Systems (HMIS).
In the facility setting, personnel must be aware of what data are needed. Sample
data-collection tools are included, recognizing that countries use different datamanagement systems for HMIS, so the CVD monitoring tools will be adapted to work with the HMIS system being used by the country, such that the indicators can be collected with minimal disruption/work to existing systems and tools
more
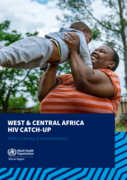
The Transformation Agenda (TA) ushered in an ambitious reform process intended to transform the World Health Organization (WHO) into an organization that is proactive, results-driven, accountable and which meets stakeholder expectations, towards transforming and improving public health services in t
...
he African Region. It aimed to achieve a WHO that is pro-results, which optimally and creatively targets technical work as well as make operations more responsive, with greater effectiveness in both communications and partnerships. The Africa Region has been the epicentre of the human immunodeficiency virus (HIV) epidemic and it’s one of the leading causes of disease and death on the continent. The WHO, with partners, has worked tirelessly for many years to control the threat and reduce the negative impact of the disease. Since the early 2000s, significant progress has been made in the global fight against the scourge of HIV. However, the WCA subregion was falling concerningly behind ESA on several key indicators of progress. In 2016, the WHO joined UNAIDS, UNICEF and other partners in a call for a strong and urgent response to support WCA countries to develop catch-up plans to triple and fast-track ART coverage, to enable the region to catch up with ESA by the end of 2020. Implementation of a widespread test-and-treat strategy, coupled with the scale-up of differentiated service delivery (DSD) and mobilization of requisite funding, accelerated WCA’s progress towards this goal. The HIV treatment catch-up and fast-track plan has achieved its target of seeing the West and Central African region (WCA) catch up with the Eastern and Southern African region’s (ESA) antiretroviral coverage rate of 78% in 2021, albeit later than the 2020 target time frame. A 33% improvement was achieved in WCA, against 21% in ESA, between 2015–2020. WCA achieved a significant 42% increase, compared to ESA’s 23%, between 2015 and 2021, to see WCA draw level with ESA at 78%. In the Democratic Republic of the Congo (DRC) alone, progress of up to 47% was observed between 2015 and 2020, for example. In addition, 1.6 million more People Living with HIV (PLHIV) were enrolled on antiretroviral treatment (ART) between 2015 and 2020.
more


Indicators are a representation of reality. They are just numbers on a piece of paper or on a computer screen, but they stand for something far greater – the success of your project. Indicators ar
...
e usually defined in the context of project planning and show something about or give an indication of progress towards realising the project goal, without being complete or comprehensive. Of course, there could be other representations of this reality, such as stories (Dart and Davies, 2003) or drawings (Feuerstein, 1986) or photographs (Tijm et al, 2011). However, indicators are a widely accepted way of representing what is being achieved in a programme or project.
more

The indicators and questions in this document are designed for use by national AIDS programmes and partners to assess the state of a country’s HIV and AIDS response, and to measure progress towards achieving national HIV targets. Countries are enc
...
ouraged to integrate these indicators and questions into their ongoing monitoring efforts and to report comprehensive national data through the Global AIDS Monitoring (GAM) process. In this way they will contribute to improving understanding of the global response to the HIV epidemic, including progress that has been made towards achieving the commitments and global targets set out in the new United Nations Political Declaration on HIV and AIDS: Ending Inequalities and Getting on Track to End AIDS by 2030, adopted in June 2021, and the linked Sustainable Development Goals.
more